
Understanding biases in temperature forecasts can allow traders to make more informed decisions about which cities are more consistent or more volatile. Usually cities that are closer to the equator and more coastal have more predictable daily highs/lows as opposed to arid deserts and plains. Being able to track these daily forecasts for each model allows us to create a bias-adjusted forecast that takes into account recent deviations to the actual daily high/low.
For example, for the past 30 days San Antonio has had the lowest MAE (Avg. Error) at 0.8° (for all cities, using daily high temperatures in the past 30 days). Looking at the high and low misses can help create a threshold as a safety net as well. The worst miss above the forecast for San Antonio was +1.5° and the worst miss below was -1.7°. If the ensemble forecast is 90°F, its largest errors over this period would imply a historical range of roughly 88.3°F to 91.5°F. That doesn’t guarantee the temperature stays inside the range, but it gives us a useful picture of recent forecast uncertainty.
San Antonio Model Accuracy - Past 30 Days

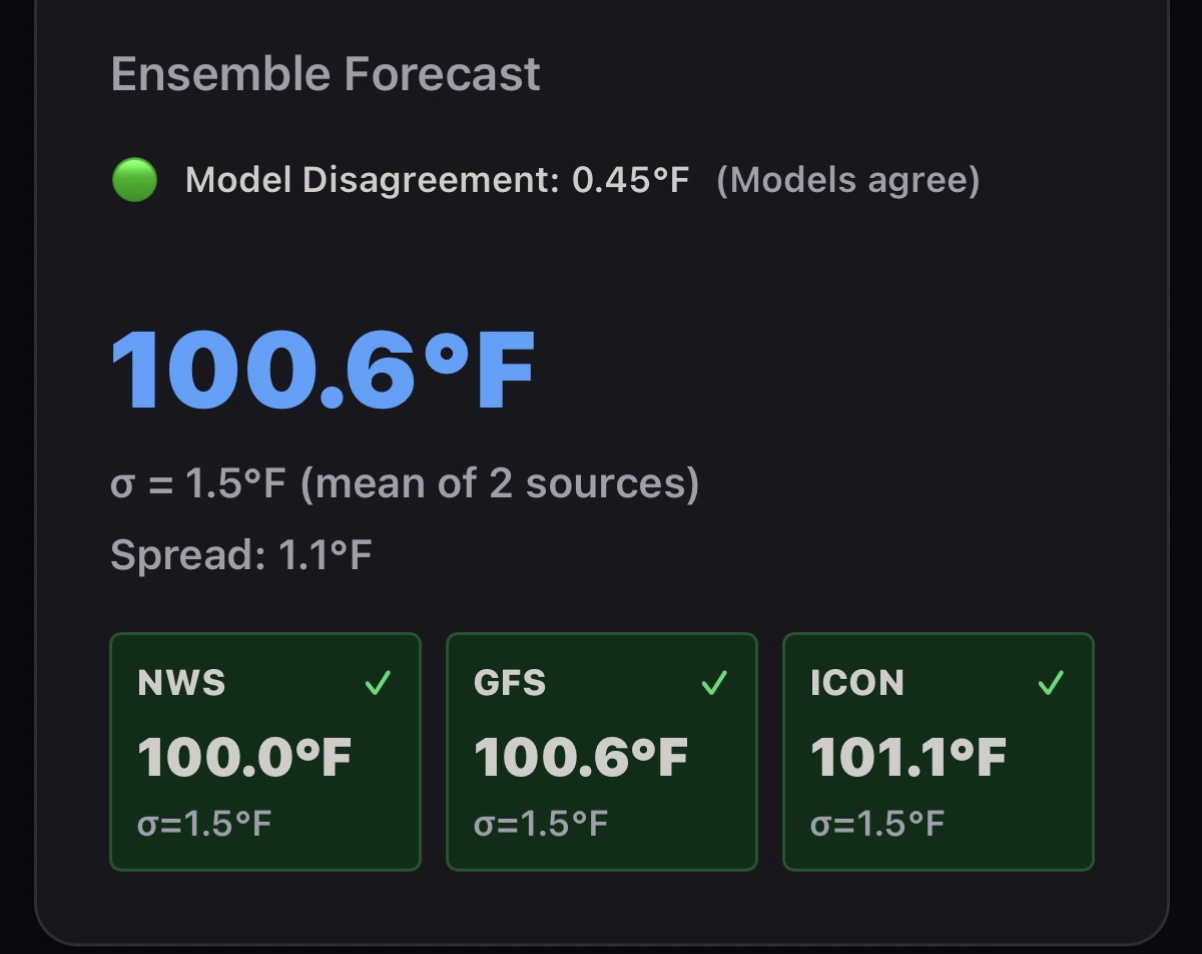
Having this safety threshold can allow traders to take more certain trades, especially when the models are agreeing with each other. Each city has 3 weather models, with the 4th being an equally weighted ensemble forecast to minimize error and generalize the forecast. When the 3 models “agree with each other” meaning that when the forecasts are closer together, it generally indicates lower forecast uncertainty and gives us more confidence in the ensemble forecast.
San Antonio Daily High Forecast - 9/3/26
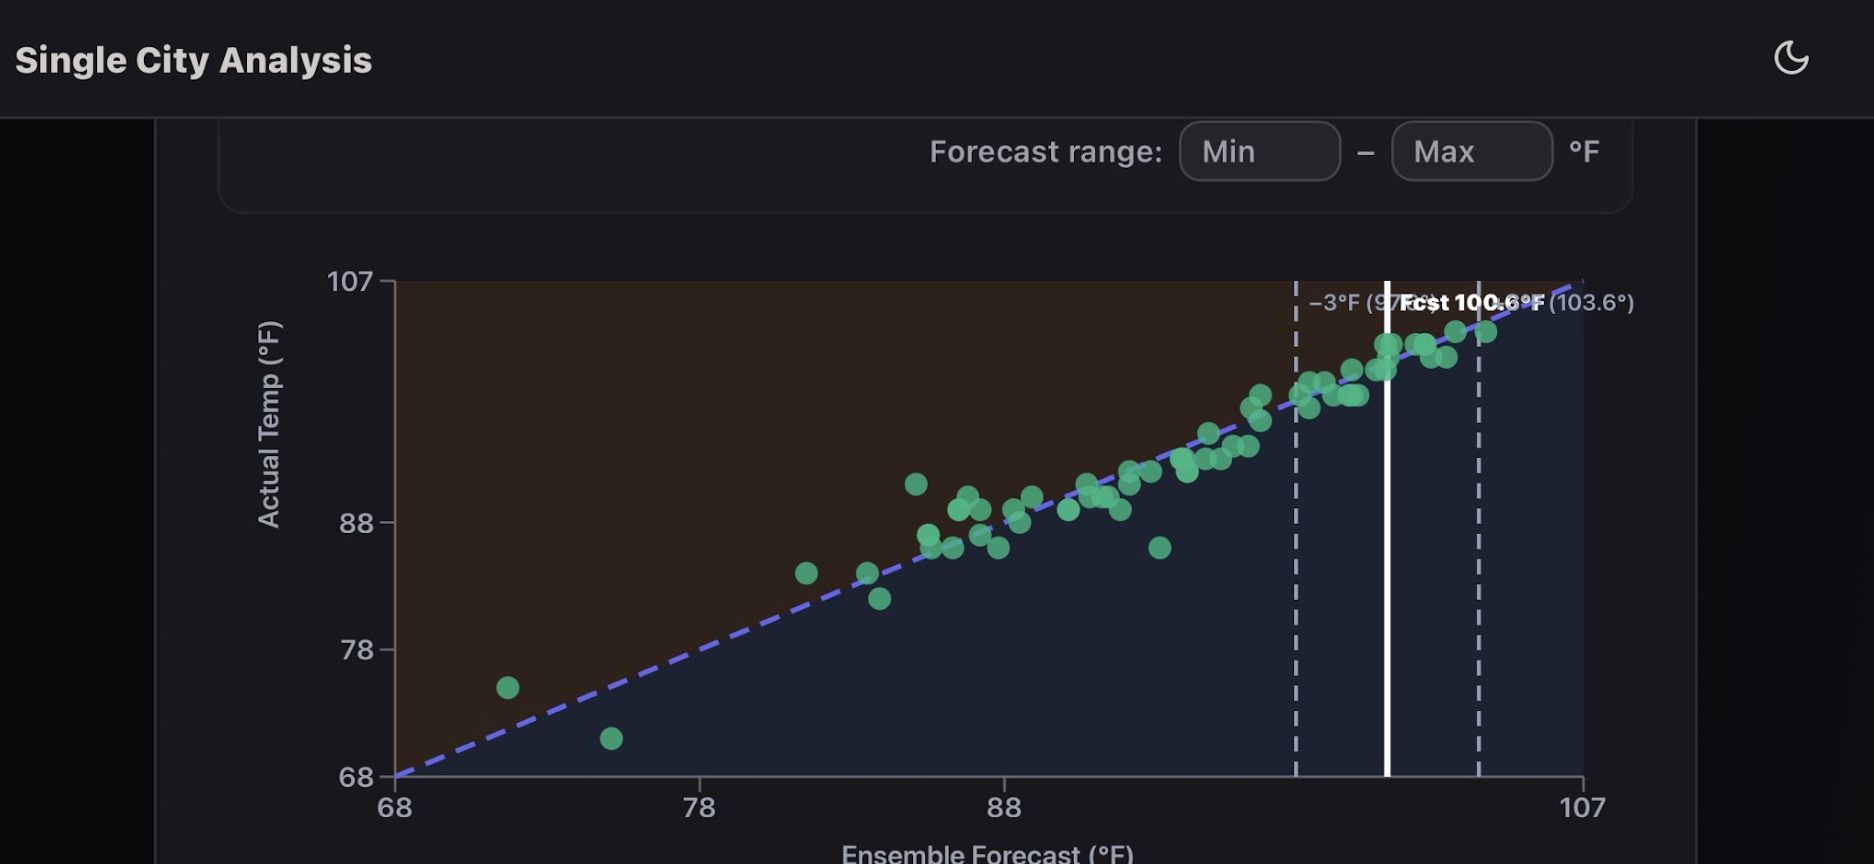
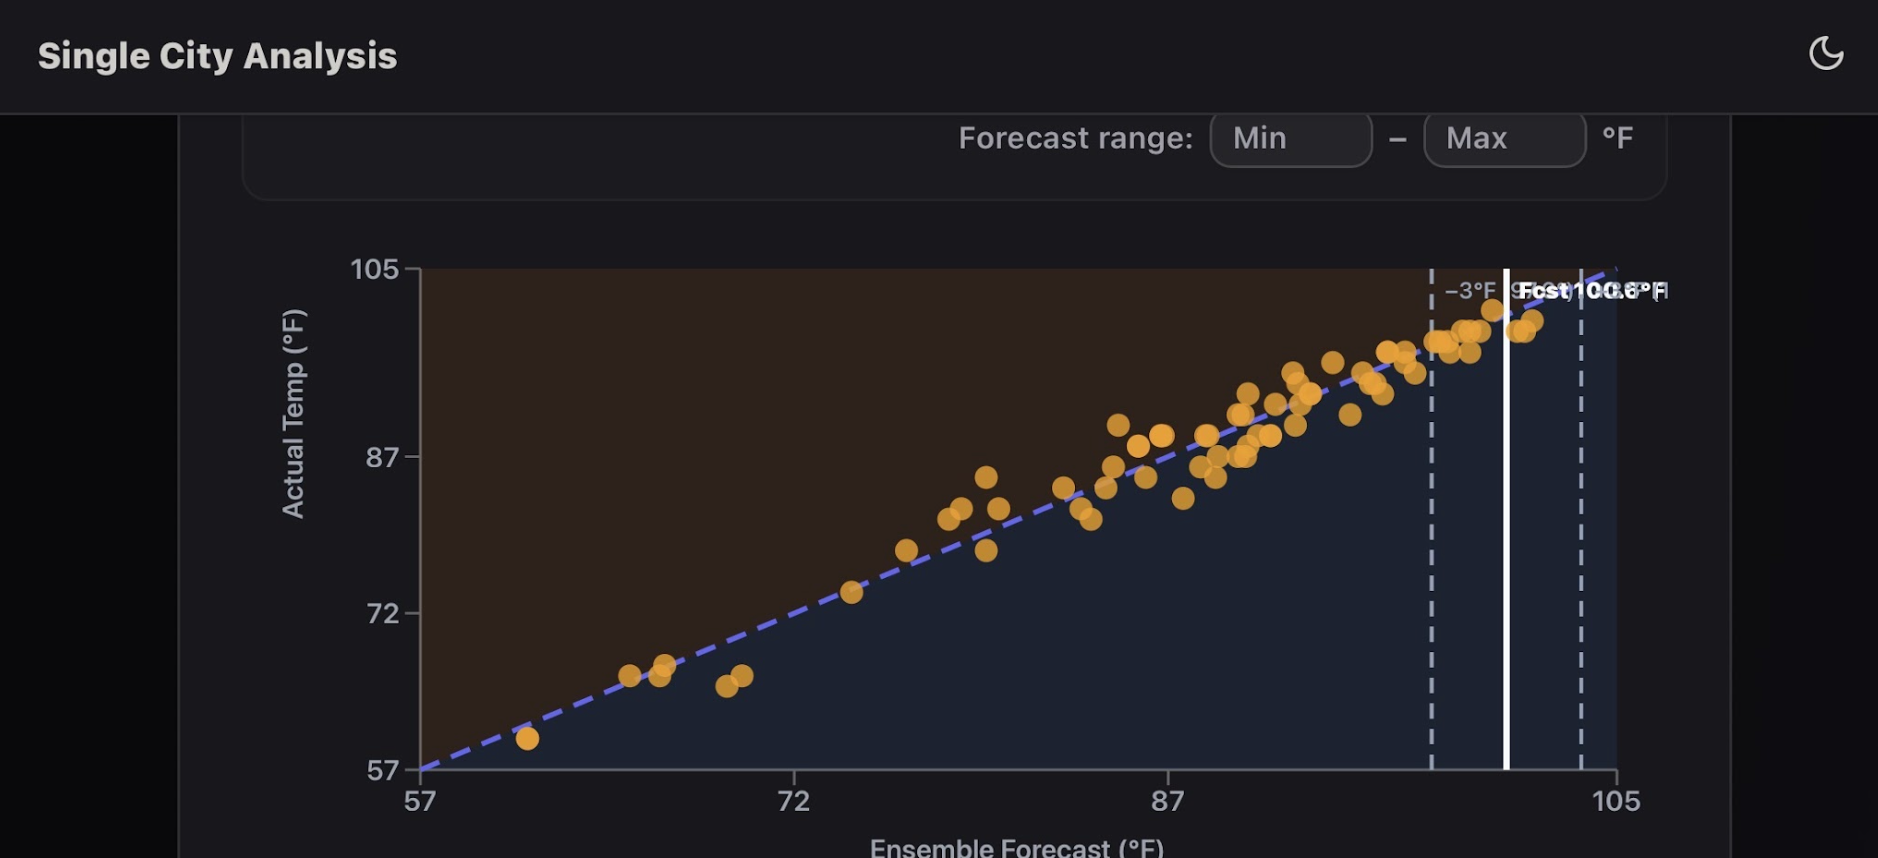
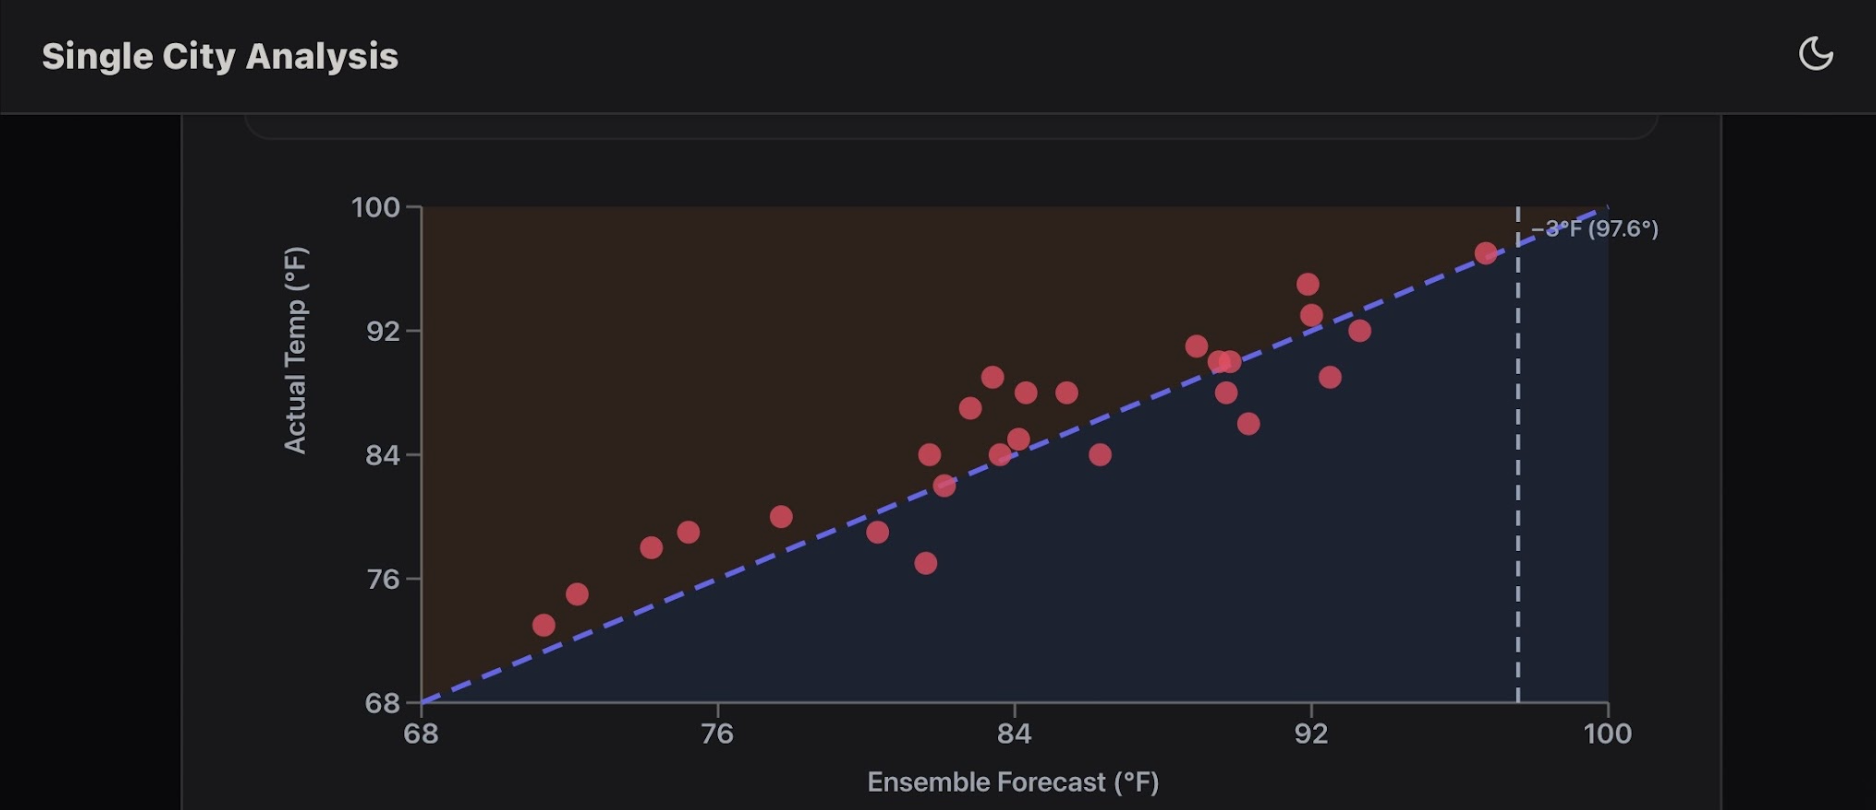
Below is a visual representation of the past 160 days of San Antonio’s forecast accuracy. The green dots are when the model agrees, yellow is slight disagreement, and red is disagreement. The dotted blue line indicates a perfect forecast, and anything above it means the actual temperature finished higher and if it’s below the blue line it means it finished colder that day. Knowing if models are agreeing or not can help traders find more confident trades and evade risky ones.
Model Agreement
Moderate Model Agreement
Wide Model Agreement
Trade Weather / Climate on Kalshi
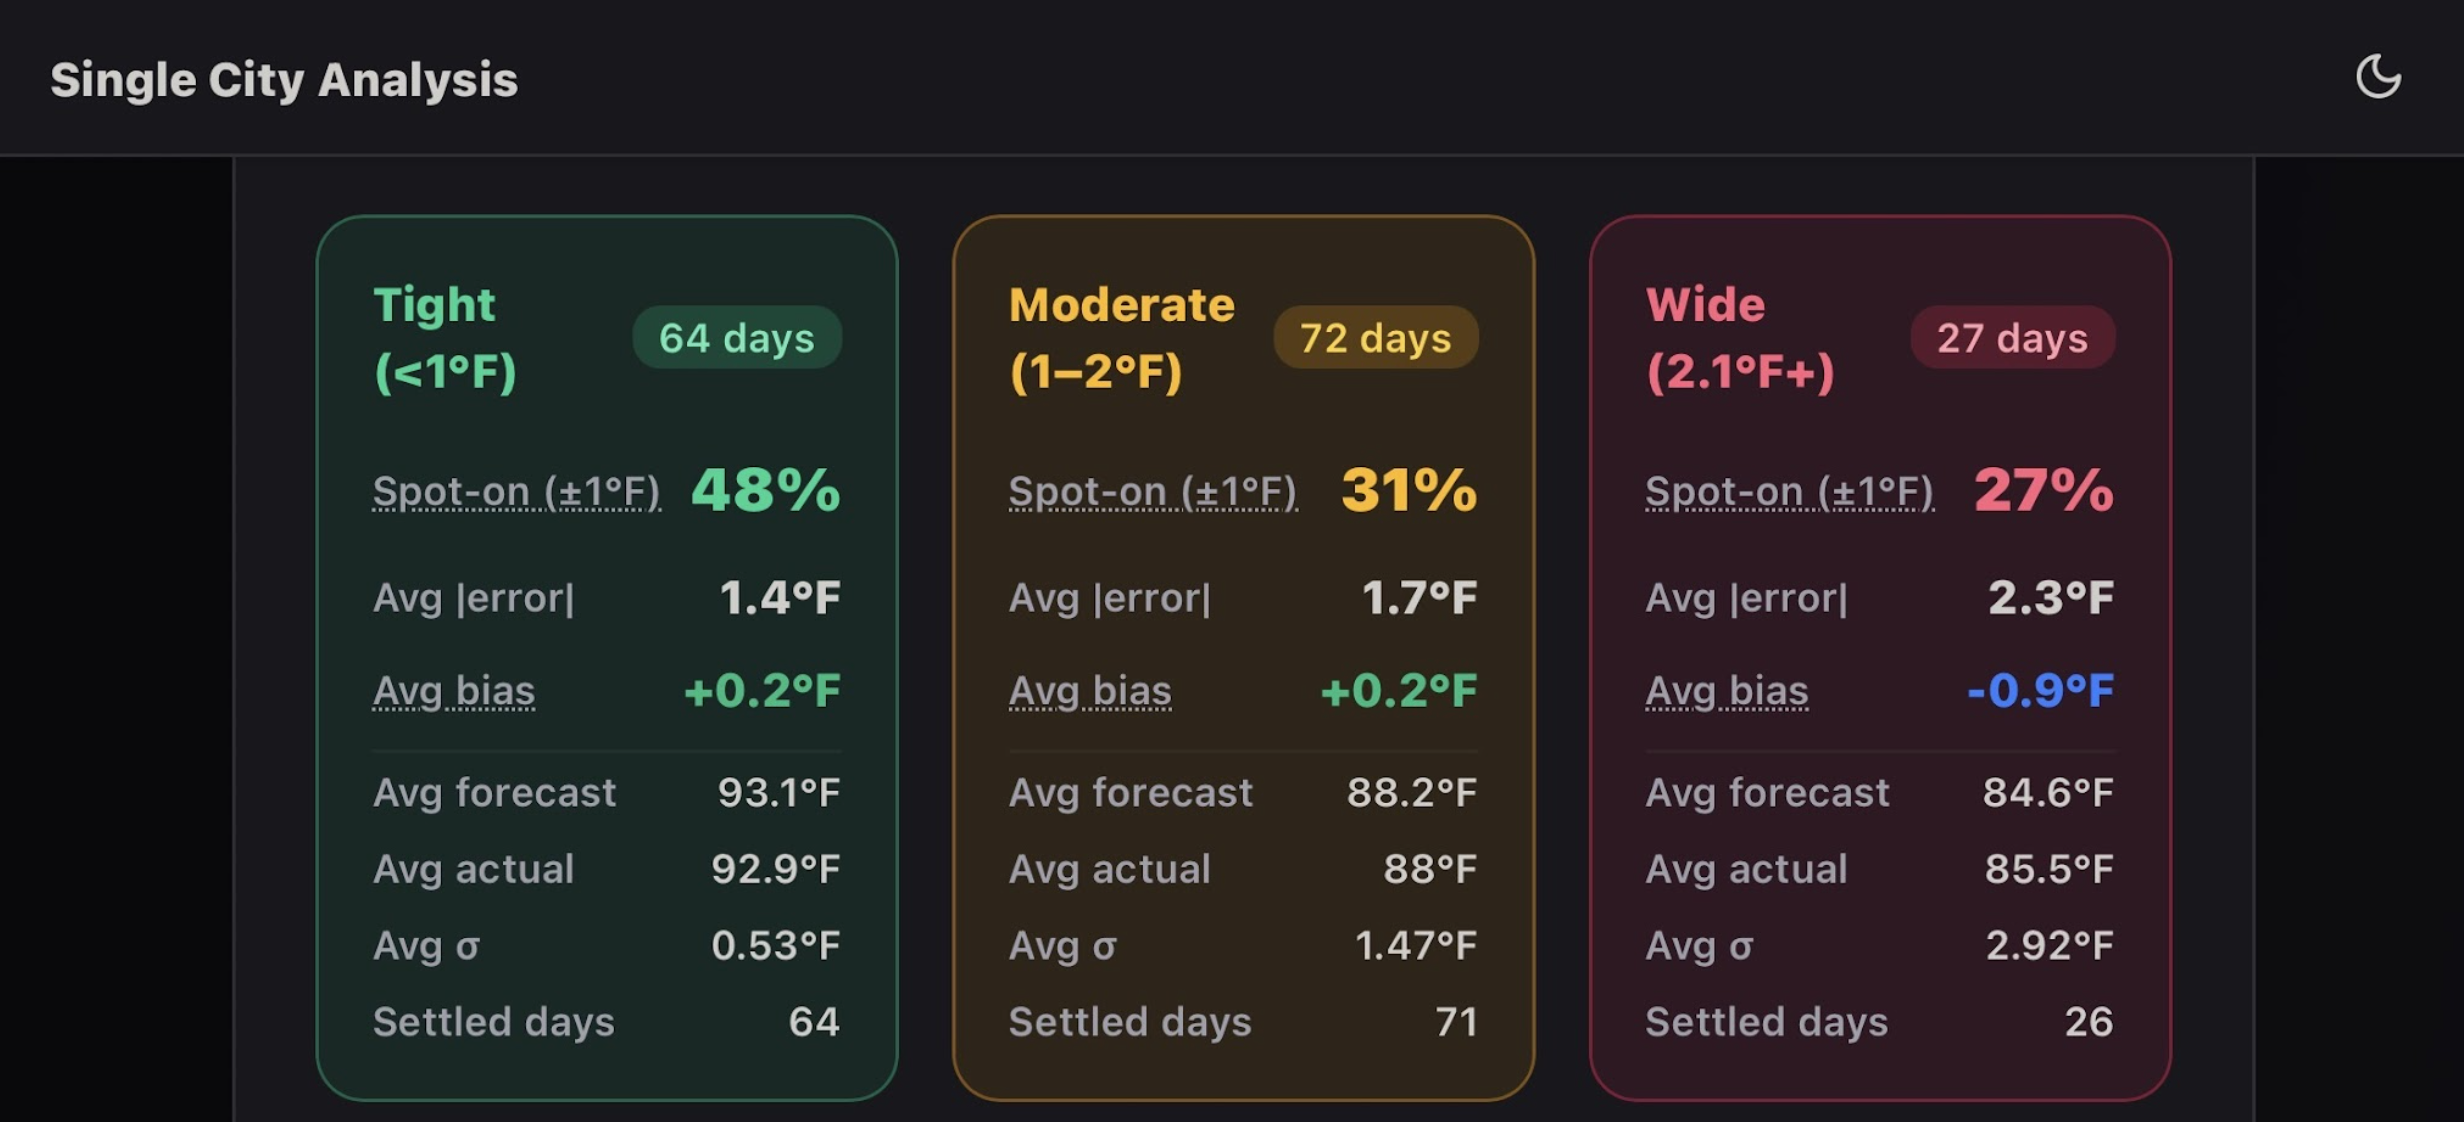
As seen below, when the models tightly agree, 48% of forecasts finished within ±1°F of the actual temperature. That falls to 31% during moderate disagreement and 27% during wide disagreement. The same pattern appears in average error with tightly grouped forecasts missing by an average of just 1.4°F, compared with 1.7°F during moderate disagreement and 2.3°F during wide disagreement. This suggests that tighter model agreement is associated with lower forecast uncertainty, which can help identify higher-confidence trading situations.
San Antonio Model Agreement Stats - Past 160 Days
Market Example:
Suppose the ensemble forecasts 90°F and all three models fall between 89.7°F and 90.4°F. Historically, San Antonio forecasts with this level of agreement have been much more accurate than days when the models are spread several degrees apart. If the prediction market is pricing 94°F+ as likely, the combination of tight model agreement and the city’s recent error range could provide evidence that the upper-temperature contracts are overpriced.
Conclusion:
Overall, combining model accuracy, historical forecast bias, and model agreement can provide traders with a clearer picture of forecast uncertainty. San Antonio shows that when models are closely aligned, forecasts tend to have smaller errors and are more likely to be near the actual temperature. Using these factors together can help traders identify higher confidence opportunities, set reasonable safety thresholds, and avoid trades when model disagreement signals greater uncertainty.
This article reflects weather forecast model accuracy and market activity, not directional predictions, trade recommendations, or investment advice. Contract prices shown are point-in-time and may change. PredictQ is a marketing partner of Kalshi and may receive compensation for referrals.