
Hormuz Strait Weekly Vessel Traffic: Proxies in Parallel
A sustained reopening of the Strait of Hormuz could bring renewed shipping activity and fresh interest in markets tied to its recovery. Volatility in vessel traffic could also attract greater trading volume and liquidity.
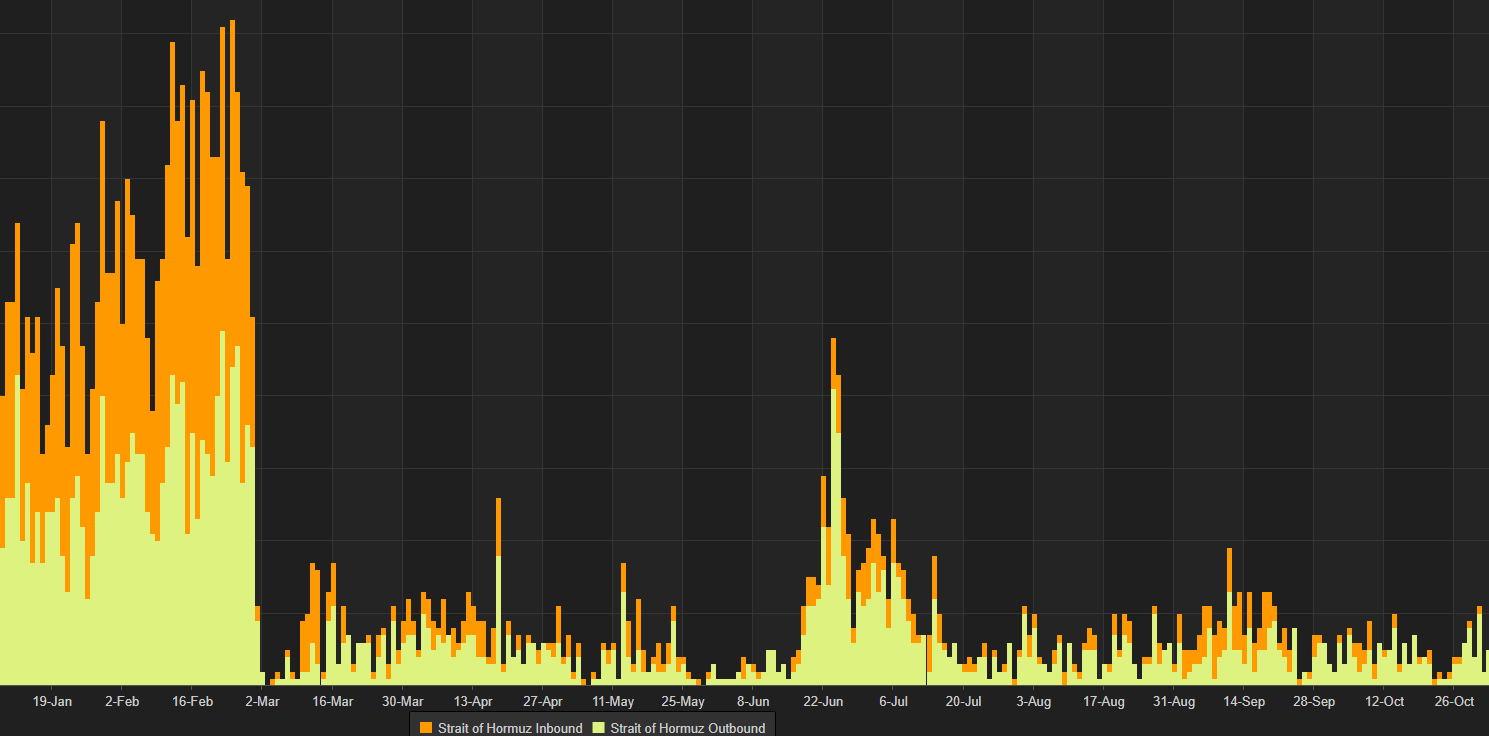
Start with the settlement source
Marine traffic is fascinating because so many forces intersect. The political climate. Vessel queues outside the Strait. Marine insurance restrictions and tariffs. There's no shortage of angles to explore.
But I think another way to observe how those forces play out in real time is to find alternative data feeds that track activity alongside the settlement source.
Sporting events and economic releases don't always offer the same opportunity to observe independent data tracking the settlement outcome. You're often trying to predict an outcome from much of the same information everyone else sees. I can't clone an NBA team and see how it'd perform under identical conditions.
The appeal of Kalshi's weekly Hormuz traffic market goes beyond the headline: start with the settlement source. Kalshi uses IMF PortWatch for official contract settlement. The IMF publishes its daily vessel-crossing observations weekly, with updates scheduled for Tuesdays at 9 a.m. ET, according to its data and methodology page.
Several outside sources estimate the same underlying activity but publish findings daily. That creates a timing mismatch we can study.
We can attempt to use independent proxy data to forecast the underlying settlement before the market prices it in.
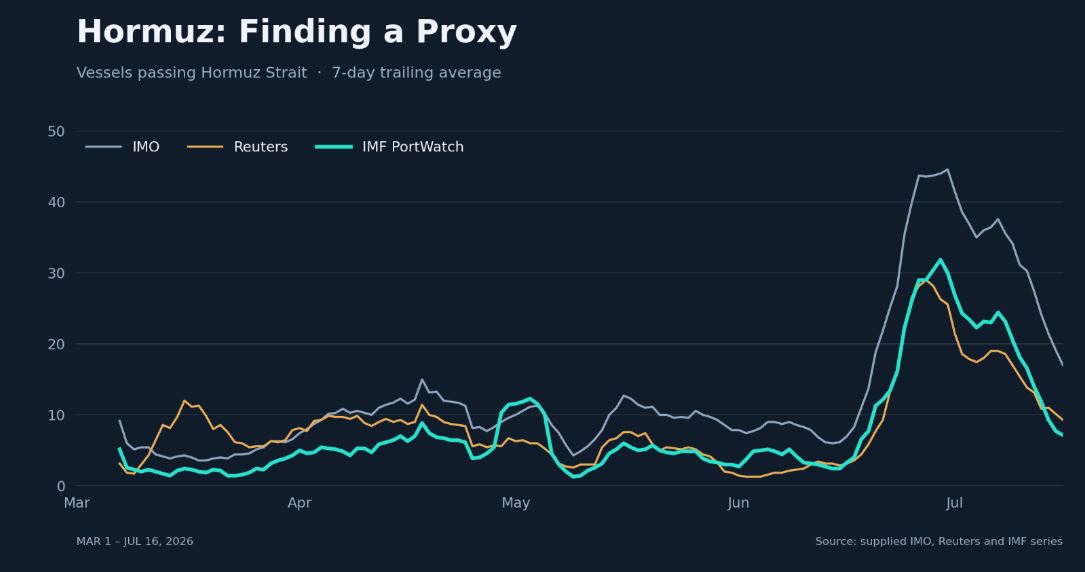
Compare the proxies
The more independent shipping-traffic sources we can find, and the further back their historical observations extend, the richer our comparison against the settlement source becomes. The comparison below uses the sources labeled IMO, Reuters and IMF in our dataset. Shipping and logistics data is available from providers including Windward, Bloomberg, LSEG, Kpler and IMO.
Differences in vessel coverage across our proxies are okay! Different timestamps, crossing boundaries and treatment of disrupted tracking signals can produce different totals. A useful proxy doesn't need to match exactly. It needs a relationship with the settlement source that's consistent enough to help forecast it.
Hypothetically, a source that regularly counts 25% fewer vessels can still be informative. The question is whether that gap stays predictable as conditions change.
Pre-conflict observations provide a larger sample of crossings, while disrupted periods test whether those relationships hold under different conditions. Seven-day averages make shared movements easier to see, although similar-looking lines alone don't establish forecasting accuracy. Correlations break down all the time, so it's worth checking multiple signals rather than relying on one.
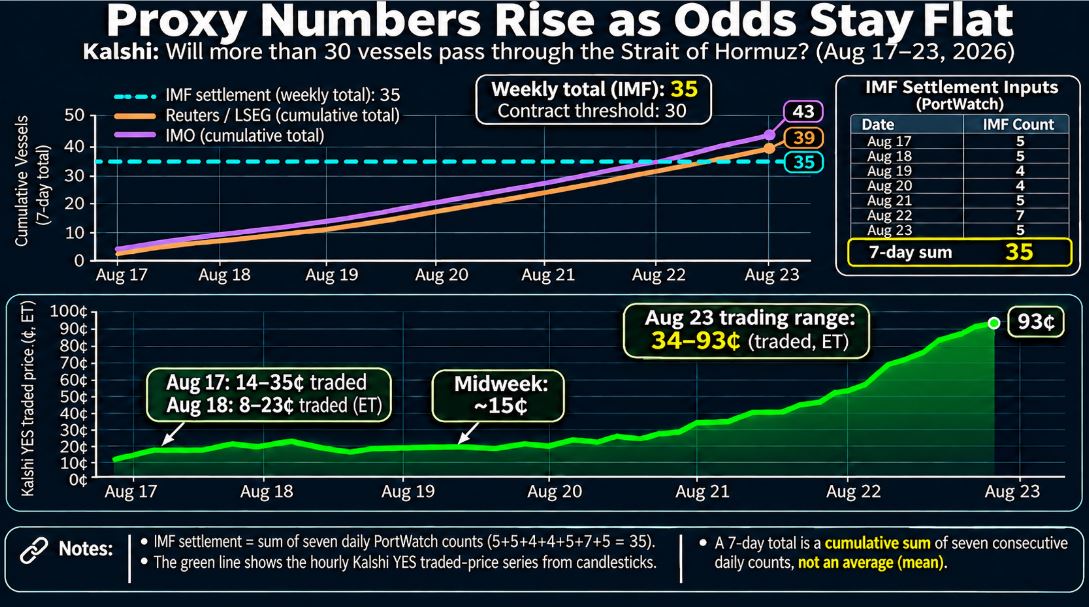
The 7-day average data shows the proxy relationship, not a specific contract. "Sourced Proxy Average" represents IMO and Reuters data. The IMF settlement sums the seven daily vessel counts for the contract week rather than averaging them; our reconstructed proxy uses IMO and Reuters/LSEG observations to estimate that same weekly total. Reconstructed proxy data is available the following day, though next-day availability alone doesn't establish a point-in-time backtest.
The August 17–23 example
The "Will more than 30 vessels pass through the Strait of Hormuz?" August 17–23 market captures that idea. Shipping activity was strengthening before the market priced in a higher likelihood of clearing 30 vessels. YES contracts traded between roughly 8¢ and 35¢ from Monday through Friday. By Sunday, traded YES prices ranged from roughly 34¢ to 93¢.
The proxy pointed toward a threshold the market initially treated as a long shot. The seven-day average and individual days leading up to settlement support the bullish argument that vessel traffic was trending above the threshold.
The comparison has three stages:
What probability does the market assign to exceeding 30 vessels?
What does our proxy model suggest as daily observations arrive?
How much of that developing picture is already reflected in the price?
The proxy data suggested that vessel traffic was strengthening, while Kalshi continued pricing the "Over 30" outcome at just 8–35¢ through Friday, despite rising vessel counts in our independent sources. As observations accumulated, we began to see confirmation of stronger shipping activity while market expectations remained relatively subdued.
The opportunity isn't simply seeing vessel activity sooner. It's determining whether that earlier information can reliably forecast IMF settlement outcomes before the market fully incorporates it. A proxy that consistently tracks the settlement source, even with a predictable difference in counts, could offer an informational advantage when evaluating Kalshi's weekly contracts.
Who this is for
Iran will go down as one of the main themes that shook the world in 2026. The ripple effects of Hormuz on prices around the world drew plenty of attention this year. I think the different ways to slice and dice the situation can appeal to anyone interested in financial, geopolitical or economic events.
Remember, breaking fundamental news drives the numbers in the spreadsheets, so the port data can get trumped by, you know, Trump. Traffic data works best as one input alongside other measures. This is a relatively new market with limited data, so treat it with caution.
This article includes links to PredictQ partners like Kalshi. We may earn a commission if you use them. It doesn't cost you anything extra, and it helps keep the lights on here. Nothing in this piece is investment advice, and prices and odds can change.