
How We Price Correlated NFL Combos
By the PredictQ Team
Summary
PredictQ's NFL Combo Pricer estimates the fair probability that two or more legs in the same game all hit, then compares that estimate with quoted prediction-market prices.
The method is a game-level simulation. Each game is played out 50,000 times, each individual leg is calibrated to its market price, and the combo price is the share of simulated games in which all legs hit.
Here's how it works, why correlation matters, and what the evidence says so far. We'll walk through the simulation, its four validation tests, its weak spots, and a dated snapshot of prices and fees across three venues.
Why correlation matters
A parlay priced as the product of its legs assumes the legs are independent. For same-game combos they're usually not. The standard way to measure this is the correlation multiplier:
multiplier = P(all legs hit) ÷ (P(leg 1) × P(leg 2) × ...)
A multiplier of 1.00 matches the independence benchmark for that combo. Above 1.00, the legs hit together more often than the product of their individual probabilities implies. Below 1.00, less often.
The table below shows observed multipliers from NFL historical data, 2016 through 2025. Each player's line is set at his trailing median, so each leg is roughly a 50% proposition.
QB over + his WR1 over | 3,172 | 1.28x |
QB over + his TE over | 2,315 | 1.22x |
QB over + his RB receiving over | 1,613 | 1.24x |
Two pass catchers on the same team both over | 3,865 | 0.98x |
Opposing QBs both over | 1,688 | 1.05x |
Top two anytime TD scorers on the same team both score | stratified by TD rate | 0.96x |
The table supports three points.
First, the QB-to-receiver link is large. At a 1.28x multiplier, the fair price of QB over plus WR1 over is 28% higher than the product of the two legs. Kalshi and Polymarket US quote a combo as one contract, and the market makers answering those quotes price this correlation in, so a trader who multiplies the legs will misjudge whether a quote is fair.
Second, the correlation isn't always positive. Two receivers on the same team split one pool of targets, and two teammates scoring touchdowns compete for a limited number of scores, so both combos sit slightly below 1.00. The "shootout lifts everyone" effect is small once the spread and total are accounted for: opposing teams' points correlate at 0.03 across 2,599 games, and opposing teams' plays run correlate at -0.44, because possession is shared.
Third, a fixed rule of thumb per combo type isn't accurate enough. Across the 26 QB plus top receiver combos priced on October 2, the middle 80% of games ranged from 1.20x to 1.42x, depending on how concentrated the offense is and where the lines sit. A constant "QB plus WR is 1.3x" would be off by 10% or more in a fifth of games. The model therefore computes the multiplier per game and per line.
How the model works
Game-level simulation
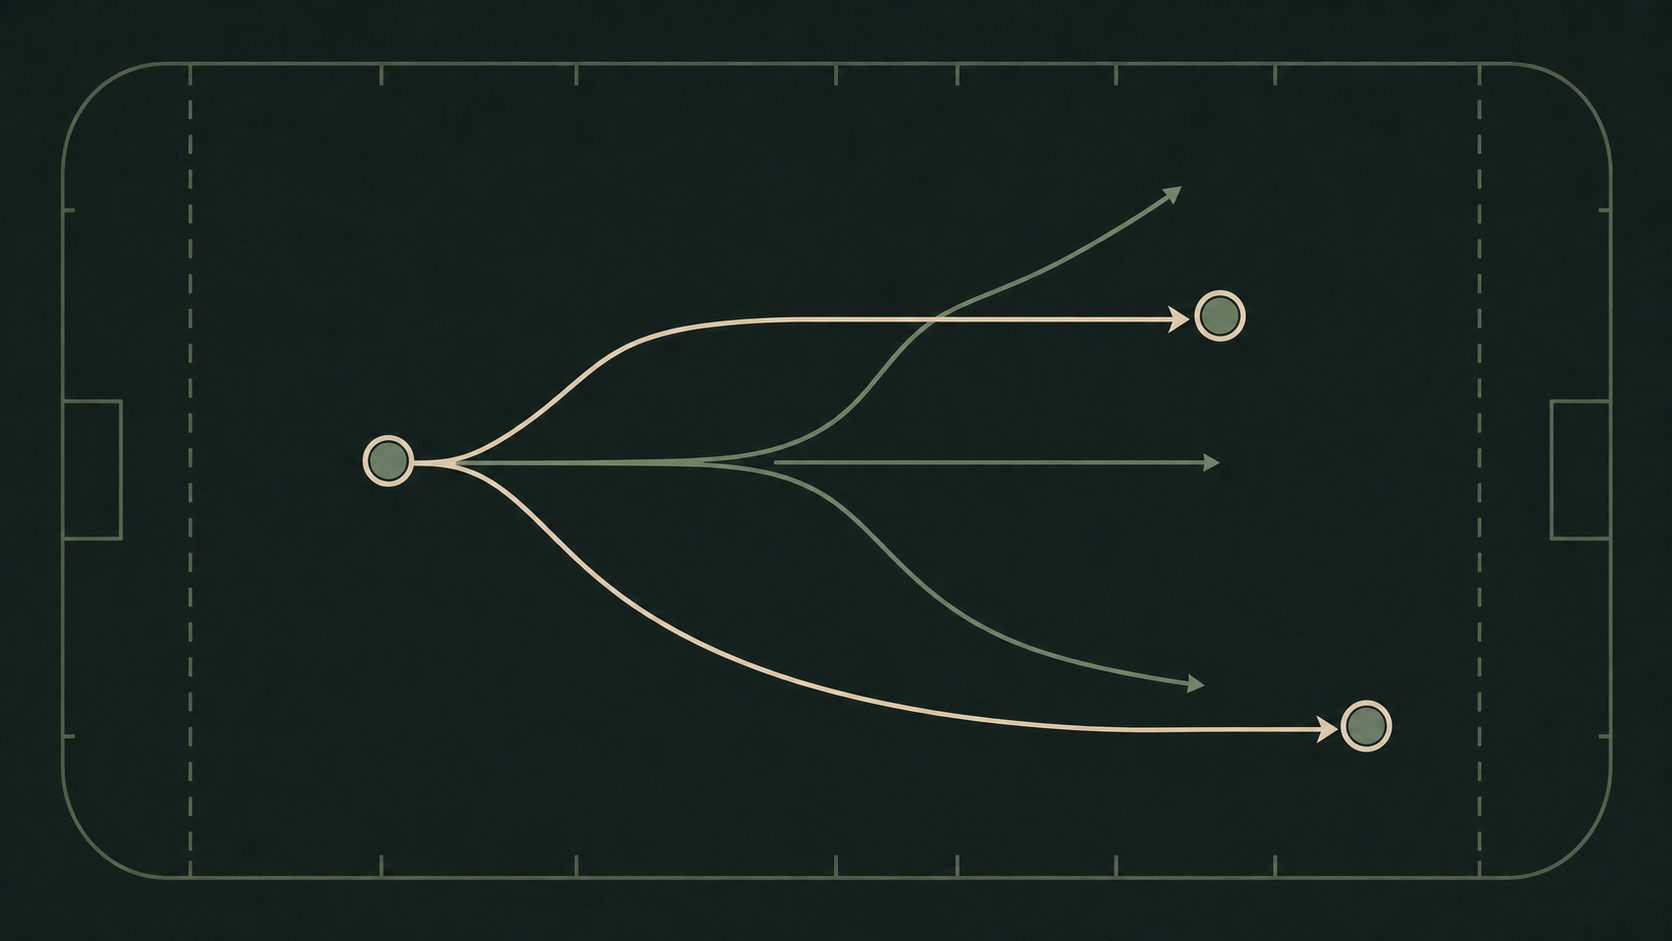
The model simulates the whole game and reads every leg off the same simulated box score. One mechanism therefore handles any number of legs and any mix of stat types, without a separate correlation estimate per pair of legs.
Each of the 50,000 simulated games proceeds as follows:
Our model uses a weighted draw to determine the number of dropbacks and rushes.
Those plays are allocated among the players on the field according to each player's projected usage.
Each target or carry draws yards and a touchdown outcome modeled from that player's profile.
Team touchdowns, field goals and points are accumulated from the same plays, so spreads, totals and team totals are stats in the same box score as the player props.
To price a combo, the model keeps the simulated games in which every leg hit and divides by 50,000. That ratio is the fair price. A two-leg and a four-leg combo are priced the same way.
Calibrating each leg to the market
The model makes no claim about any single leg, such as whether Ja'Marr Chase clears 80 receiving yards more or less often than the market says. Each stat's simulated distribution is rank-mapped onto the venue's ladder of lines so that the simulated probability of each leg equals the venue's current price at every strike, to the cent. What the simulation contributes is the dependence between legs, which a single-market price can't express.
This is also why the model can be judged on correlation alone. If each leg is priced where the market prices it, any difference between the model's combo price and the product of the legs is entirely the modeled correlation.
The five components and the evidence for each
Each component below was fit on NFL play-by-play and box scores from 2016 through 2025 (nflverse). The number in each item is the historical fact the component reproduces.
Shared game script. Both teams' dropbacks, rushes and touchdowns move together through one latent draw per game. Opposing teams' plays run correlate at -0.44 because the clock is shared. Teams that score run more and force the other side to throw.
Volume responds to the game state. Trailing teams throw more. This is the channel that makes opposing quarterbacks' passing yards slightly positively related (+0.13) even though their attempt counts are negatively related (-0.18).
Target and carry shares vary by game. A player's share of his team's targets on a given day varies around his baseline following a Dirichlet draw with concentration about 20, and teammates compete: when WR1's share is up, WR2's is down (-0.18). In the backtest this component accounts for the largest share of the model's gain over independence.
Per-touch efficiency is independent across teammates. A receiver's yards per target on a given day correlates -0.02 with his teammates'. The QB-to-receiver link comes from volume plus arithmetic (a receiver's yards are part of the QB's yards) rather than from a shared efficiency effect across the offense. Efficiency is therefore drawn independently per player.
Touchdowns and weather. Team touchdowns are distributed more tightly than a Poisson distribution and are tied to the team's realized yards per play. The link is stronger for the underdog, because historically an underdog whose QB throws well tends to keep the game close. Weather is accounted for in addition to the other factors. For example, wind enters from the forecast: yards per target fall about 0.024 per mile per hour of wind, and the pass rate falls at 20 mph and above.
Inputs and settlement
All inputs are pulled automatically. We don't share every input, but they include sportsbook and prediction-market lines for players and games, player usage from nflverse, and player and team ratings from third-party sources. Settlement uses the official box score.
Validation
The model has been tested four ways: a walk-forward backtest on 2022 to 2024, a holdout on 2025, a comparison against live Kalshi market-maker quotes, and one week of settled games. We are continuing to test and refine the model as we get more data in the 2026 season. The scoring metric throughout is log loss, with independence (the product of the legs) as the baseline. Lower is better, and confidence intervals are bootstrapped by game.
Walk-forward backtest, 2022 to 2024
For 623 regular-season games in weeks 5 through 18, the simulator ran with information available before kickoff: the closing spread and total, usage from earlier that season and the one before, and a volume model fit on the four prior seasons.
Who played is taken from the box score, and one correlation matrix was fit on all ten seasons. There are no historical prop lines in the data, so legs sit at the model's own median or 80th percentile rather than at a real market line.
Across 24,530 combos, log loss was 0.4755 for the model and 0.4823 for independence, a gain of 0.0068 per combo with a 95% interval of +0.0048 to +0.0089. The direction of the modeled correlation matched the realized direction on 11 of 12 archetypes. The exception is two same-team players both scoring a touchdown, which the model has slightly below 1.00 and the data had slightly above.
QB over + pass catcher #1 over | 1,228 | 1.31 | 1.32 |
QB over + pass catcher #2 over | 1,228 | 1.24 | 1.23 |
QB over + pass catcher #1 at a 20% alt line | 1,228 | 1.62 | 1.65 |
QB over + pass catcher #1 under | 1,228 | 0.70 | 0.60 |
Two same-team pass catchers over | 1,246 | 0.95 | 0.98 |
Both QBs over | 605 | 1.09 | 1.15 |
QB over + opposing WR1 over | 1,228 | 1.05 | 1.05 |
Same WR/TE receiving yards over + anytime TD | 2,719 | 1.29 | 1.24 |
Same RB rushing yards over + anytime TD | 917 | 1.28 | 1.38 |
QB over + opposing top TD scorer | 1,228 | 1.10 | 1.04 |
Two same-team anytime TD | 1,246 | 0.93 | 1.03 |
Cross-team anytime TD pair | 623 | 1.00 | 1.00 |
Holdout, 2025 season
The 2025 season (208 games, 8,223 combos) was scored once at each model version, with no constant tuned against it. The gain over independence was +0.0045 per combo, with an interval of +0.0006 to +0.0084. The direction agreed with 2022 to 2024 on every archetype. On the positive QB-plus-receiver combos the model was conservative: QB plus WR1 realized 1.38 against a modeled 1.29. On receiver unders it was the reverse (0.71 modeled against 0.61 realized for QB over plus pass catcher #1 under), a gap that traces to where the backtest places the leg rather than to the modeled dependence.
Comparison with Kalshi market makers
On October 2, the model requested quotes on 680 standard combos across all 15 games on that weekend's Kalshi slate and collected more than 5,600 quotes, from about 8 market makers per combo. Each combo's fair price was compared with the tightest bid and ask across market makers (median spread 2.9 cents).
Fair price inside the tightest bid/ask | 68% | 38% |
Correlation of implied multiplier with the market's | 0.81 | n/a |
Mean signed gap, fair price minus best mid | +0.6c | n/a |
Mean absolute gap from the best mid | 1.2c | n/a |
On the large same-team correlations (QB plus receiver overs and unders, QB plus game total), the tightest Kalshi quotes sit within about half a cent of the model. The model's value on those combos is as a reference price before requesting a quote, not as a source of mispricing.
Settled games, one week
The games of October 4 and 5 were scored against the official box scores: 1,050 distinct combos across 14 games, using the last pre-kickoff quote on each. The slate's 15th game, Thursday's Tampa Bay at Dallas, isn't in the settlement set.
Log loss | 0.519 | 0.518 | 0.531 |
Gain over independence per combo | +0.0115 (95% CI -0.002 to +0.025) | about +0.013 (derived from the log losses, no interval computed) | 0 |
Games better than independence | 8 of 14 |
The model and the market makers were indistinguishable against each other (the market was better in 7 of 14 games). The individual legs the model is calibrated to were fair: 520 distinct legs were priced at 0.453 on average and hit 0.446. Both the model and the market beat independence by about a point of log loss, but with 14 games the interval on the model's gain still includes zero. At this rate it needs three or four more weeks of settled games to clear it. The settlement scorecard runs every Tuesday and the results will be added here.
Where the model and the market differ
Three archetypes were quoted at or near independence by the tightest Kalshi market maker on October 2, while the 2022 to 2025 backtest puts them above 1.00:
Both QBs over | 810 | 1.14 | 1.05 to 1.23 | 1.07 | 1.00 |
QB over + opposing WR1 over | 1,641 | 1.07 | 1.02 to 1.12 | 1.04 | 0.98 |
QB over + his top WR/TE anytime TD | 1,641 | 1.16 | 1.09 to 1.22 | 1.10 | 1.04 |
Opposing quarterbacks' attempts are negatively related (shared clock). The positive link runs through efficiency: when one team moves the ball, the other has to throw to keep up. A correlation of attempt counts won't show it. It appears only when volume is allowed to respond to the game state, which is component 2 above.
The gap is thin and depends on the line. On "both QBs over" it's about 2 cents on a 30-cent contract, roughly one bid/ask spread. The multiplier rises with the line: two QBs both clearing a line they beat 30% of the time hit together 1.15x as often as independence (interval 1.04 to 1.25), while at a line they beat two-thirds of the time it's 1.02x. At the lines the market actually trades, history sits closer to 1.02x to 1.05x, and at median lines "both QBs over" can't be distinguished from 1.00 in either era (2016 to 2019 or 2022 to 2025) when the eras are scored separately. The first week of settled games split: QB over plus the opposing WR1 over landed on the model's side (realized 1.06x against the model's 1.04x and the market's 0.98x), QB over plus the opposing team's top TD scorer did too (1.31x on 31 combos), and both QBs over went the other way (0.86x on 16 combos). All three are being re-scored every week.
Known limitations
One week of settled games. The backtest and holdout are the main evidence. Live evidence is one week of outcomes on 14 games, and the interval on the model's gain over independence still includes zero. The archetype to watch is same-player receiving yards over plus anytime TD, the largest group in the week at 102 combos: the model priced it at 1.32x, the market at 1.24x, and it hit at 1.04x. One week of noise can produce that. If it stays near 1.00x, both the model and the market makers are too high on that combo, and this section will say so.
The model runs slightly high. In the first full pass on October 2, the fair price was above the best ask 226 times and below the best bid 43 times. One cause was found: a tie-breaking rule in how simulated touchdowns were mapped to the market's TD prices added dependence the backtest never saw, inflating same-player yards plus TD on that week's quotes from 1.32x to 1.44x. That rule was fixed before the figures above were produced, and the model still averaged 0.6 cents above the best mid.
Tails and drift. At lines a QB clears about 30% of the time, the simulator's "both QBs over" multiplier is 1.31 against about 1.15 in history. Alt-line combos are where the model's uncertainty band is widest, and the tool shows that band. The correlation structure was stable between 2016 to 2019 and 2022 to 2025 (the 2020 and 2021 seasons sit between the two windows and weren't in either) on every archetype checked except one: QB over plus his team covers moved from 0.98x to 1.06x as the league's pass rate rose. The components will be refit each offseason.
The venue findings cover one NFL week. The cross-venue results in the next section come from two days of hourly logs, and the Monday half is a single game. They'll be updated as the logs accumulate.
Exchanges and fees
This section compares historical quotes and fee calculations for Kalshi, Polymarket US, and Novig. Polymarket US is the separate US exchange, distinct from polymarket.com. These are point-in-time price observations, not ratings of the platforms' features or quality.
Fee formulas and a worked example
Fees differ by venue and are large enough to change which venue is cheapest. The example below is one combo, Trevor Lawrence 250+ passing yards with the opposing team's Ja'Marr Chase 80+ receiving yards, quoted between 9:17 and 10:02 a.m. ET on October 4. The model's fair price was 31.1 cents. Fee formulas are from each venue's published fee schedule. Novig's documentation doesn't state whether its parlay price already includes its fee, so the fee is added on top here.
Kalshi | 31.3c | 0.07 × p × (1 − p) | 1.5c | 32.8c |
Polymarket US | 29.6c | p × (0.0695 × (1 − p) + 0.06 × (1 − p)^4) | 1.9c | 31.5c |
Novig | 35.5c | 0.10 × p × (1 − p), assumed on top of the quote | 2.3c | 37.8c |
Polymarket US was cheapest for this combo, 0.4 cents above fair all-in. Novig was 6.3 cents more expensive all-in than Polymarket US.
Analysis of results, October 4 to 19
We launched this tool internally prior to the October 4th Sunday games and have been tracking the tools strengths and weaknesses since. We analyzed 51,434 pairs on 1,538 combos across 45 games (October 4 to 19). After fees, Kalshi was cheaper on 60% of pairs and Polymarket US on 40%, by a median 0.3 cents. Polymarket US was cheaper on 31.5% of pairs in the first week (283 combos), 26% in the second (644) and 51% in the third (574).
Polymarket US is often cheaper on unders. QB over plus a pass catcher under: Polymarket US cheaper after fees on 69% to 73% of quotes across 81, 76 and 55 combos, rising to 80% to 83% in the third week.
In the third week it was also cheaper on QB over plus a same-team touchdown scorer, on 84% to 86% of quotes by about 1.2 cents (56 combos), after Kalshi had been cheaper on both in the first two weeks.
Kalshi is often cheaper on spread and cross-team legs. QB over plus his team covers: 91% of quotes, by a median 1.5 cents (51 combos). Team covers plus the top anytime TD scorer: 78%, by 1.3 cents (57). QB over plus the opposing top TD scorer: 92%, by 1.4 cents (73).
NoVig has been the most expensive of the three. On 51,949 pre-kickoff pairs across 1,615 combos (October 5 to 19), NoVig was above Kalshi's best ask 96% of the time, by a median 3.2 cents before fees, and cheaper after fees on 2.4% of pairs. It appears to build its parlay from sportsbook leg prices that already carry the book's margin.
The tool runs this comparison on every combo built in it, each venue's all-in price next to the fair price. Where a venue hasn't quoted that exact combo, the tool estimates its price from how the venue quoted everything else that week and labels it as an estimate.
The tool
The NFL Combos Pricing Tool covers every game on the current slate. Select a game and legs, and it returns the model's fair price next to any price you've been quoted. Once one leg is selected, every other option shows its multiplier with the current selection: green above 1.05x, red below 0.95x, with the fair combo price on hover. Custom lines can be typed when a venue's ladder doesn't have them, and quarter and half legs can be priced, though no venue currently sells those in a combo, so they're model-only.
Who it's for
Same-game parlay bettors on sportsbooks. The tool shows the fair price of the combo before the book's correlation adjustment and margin.
Prediction-market traders evaluating combos. The tool gives a reference price to compare against a requested quote, in the same way a DFS player checks Vegas odds before building a lineup. Market makers quote wider on combos they see less often, and a reference price shows whether a wide quote is also a mispriced one.
If you build combos the model hasn't priced, or your quotes don't match the model's numbers, bring them to the PredictQ Discord to discuss with the team and other traders.
This article includes a referral link to Kalshi. PredictQ is a marketing partner of Kalshi and Polymarket, and we may earn a commission when you use our partner links. That doesn't cost you anything extra, and it helps keep the lights on here. PredictQ has no commercial relationship with Novig. This piece describes a pricing model and historical contract quotes, not investment advice or a recommendation to trade. Contract prices, fees, and availability can change.