
Last week, while researching Iowa's Senate race, something caught my attention.
Democrat Josh Turek was leading Republican Ashley Hinson by nearly a percentage point in the RealClearPolling average, yet Kalshi had Hinson priced at 59 cents and Turek at just 41 cents.
How could a candidate leading in the polls be such a substantial underdog in the prediction markets?
Was the market missing something? Or was I?
Looking Beneath the Surface
I started by examining Iowa's electorate rather than relying solely on the headline polling numbers.
As of October 1, Iowa had approximately 713,000 active registered Republicans compared with 533,000 Democrats, an advantage of roughly 180,000 voters. Another 572,000 active voters were registered with no party affiliation, according to the Iowa Secretary of State's registration totals.
But registration alone doesn't tell us who'll show up on Election Day, much less whom they'll support.
I began examining historical turnout patterns alongside demographic breakdowns from recent polling, focusing on Iowa's 2018 and 2022 midterm elections.
The distinction mattered.
In 2018, Donald Trump occupied the White House. In 2022, it was Joe Biden. Historically, the president's party tends to lose ground during midterms, a phenomenon sometimes called the midterm penalty.
Dissatisfied voters may be more motivated to turn out, while supporters of the president's party may be less enthusiastic. It's not a universal rule, but with Trump back in the White House in 2026, the distinction seemed especially relevant.
The Independent Voter Question
Perhaps the most interesting part of the data involved Iowa's independent voters.
It's tempting to assume that independents in a Republican-leaning state would naturally lean Republican themselves. The polling, however, told a different story.
In Marist's October 8–11 survey, independents who were likely to vote supported Turek over Hinson by 51% to 31%.
Were Iowa's independents moving toward the Democrats, or were we seeing the effects of the political environment?
Many voters identify as independents because neither major party adequately represents them, even though they may consistently lean toward one side. Others are genuinely persuadable.
And in a midterm election, dissatisfaction with the sitting president can influence both voter preferences and turnout.
A shift in independent polling could reflect changing opinions, differences in who was surveyed, or changes in who's motivated to vote.
Those distinctions matter enormously when forecasting an election.
Putting the Numbers to Work
Using AI to help analyze Emerson's October polling breakdowns and historical turnout patterns, I explored how the race might unfold under different assumptions.
Under turnout scenarios resembling the 2018 and 2022 midterms, our calculations showed Hinson leading in both cases. Of course, these weren't definitive forecasts. They depended heavily on assumptions about turnout and voter preferences, but the results were consistent.
Understanding why a market is priced a certain way is very different from knowing whether that price is wrong.
Had I actually identified an edge, or had I simply found evidence supporting a conclusion I was already beginning to believe?
It's a trap I've seen countless times in poker.
Imagine you're playing against an opponent you've caught bluffing twice in a relatively short period. It's tempting to conclude they bluff too frequently, but two observed bluffs aren't enough to establish that.
Stack sizes, position, and proximity to the money all matter. A bluff from a big stack near the money might be perfectly reasonable, while the same play from a short stack could tell a different story.
Without that context, we risk mistaking incomplete information for an edge.
Prediction markets present a remarkably similar challenge.
Market Verdict
Marist's October survey revealed another interesting discrepancy. Turek led Hinson 48% to 45% among likely voters, yet 59% of likely voters expected Hinson to win. It was another reminder that supporting a candidate and expecting that same candidate to win are two very different things. The survey's margin of error for likely voters was 6.6 percentage points, so that three-point preference gap wasn't decisive.
And the disconnect didn't end there.
By October 21, the polling average had shifted slightly in Hinson's favor. But rather than rising alongside her polling numbers, her Kalshi price had actually fallen to 57 cents.
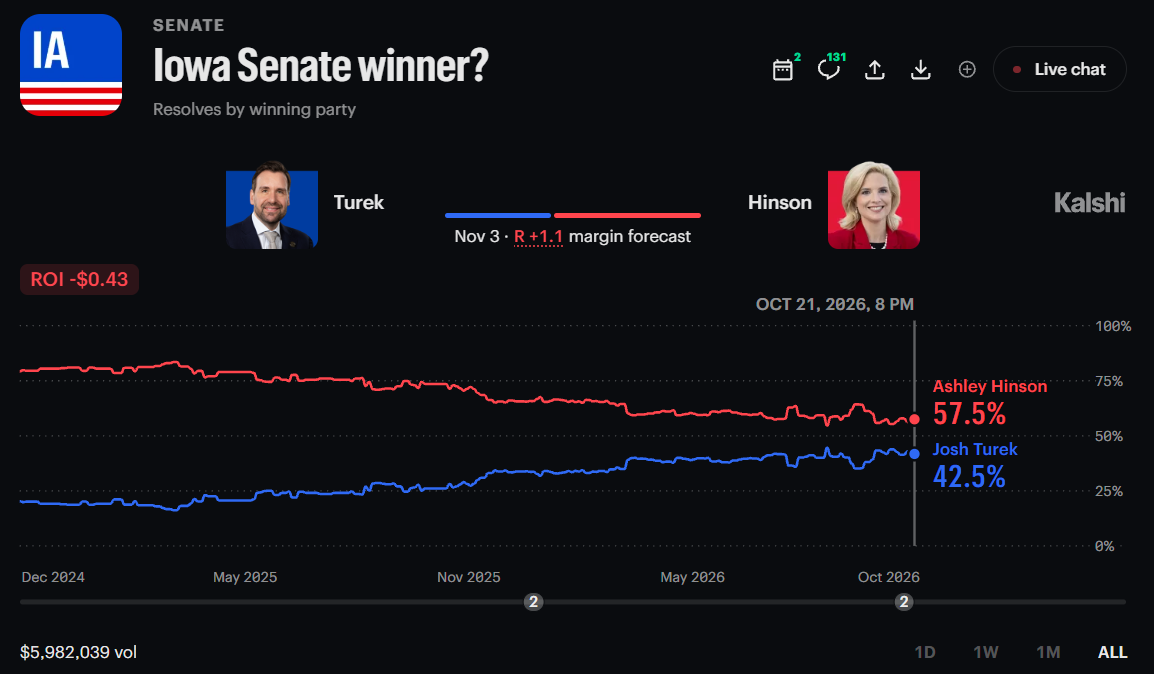
The polling and prediction market were moving in opposite directions.
Of course, that didn't necessarily mean the market was ignoring the polls. Individual surveys, turnout expectations, and other factors can tell a different story than a polling average alone.
There's another possibility worth considering. Hinson's declining market price might have little to do with Hinson herself.
A growing belief in a Democratic wave could affect Republican candidates across the country, even if nothing significant had changed in their individual races.
In other words, the market might not be reacting to new information about Iowa. It might be reacting to a changing perception of the national political environment.
Suppose ten Republican candidates all become cheaper on the same day. Did the market learn ten different things about ten different candidates, or did one underlying assumption change?
After everything I'd uncovered, Hinson's new price caught my attention. Both of my turnout scenarios had favored her, her polling position had improved, and now her contract was two cents cheaper.
That made the opportunity more interesting to me, but was it actually a bargain?
At 57 cents, I'd need to believe Hinson had a better than 57% chance of winning to justify the bet before fees. For a contract that settles at $1 if she's elected and $0 otherwise, the break-even calculation before fees is $0.57 / $1 = 57%. Fees would raise that threshold. And I'd need a good reason to believe my estimate was more accurate than the market's.
My research had given me reasons to question the market's price, but it hadn't established how likely Hinson was to win.
For anyone trying to identify value in prediction markets, I'd suggest a simple exercise. Before placing a trade, ask yourself three questions: What probability would I assign to this outcome? Why is my estimate different from the market's? And what evidence would convince me that I'm wrong?
If you can't answer those questions, you may not have identified an edge. You may have simply identified a disagreement.
Finding something the market appears to have overlooked is not the same as finding something the market actually overlooked.
Having the courage to act on an edge is valuable. Having the discipline to question whether that edge actually exists is just as important.
This article includes a link to PredictQ partner Kalshi. We may earn a commission if you use it. It doesn't cost you anything extra, and it helps keep the lights on here. Nothing in this piece is investment advice. Prices, odds, and entry counts can change.