
ICON, GFS, NWS, and the Ensemble can give four different temperature forecasts for the same city. When they disagree, which one deserves the most weight? The answer isn't always the model with the best nationwide average. It often depends on the city.
Using the October 27 dashboard snapshot, I compared all four forecast sources across 20 U.S. locations, with 27 to 29 settled observations per location. The comparison measures mean absolute error (MAE), or the average number of degrees a forecast missed the final observed temperature. Lower MAE means greater accuracy in this particular sample.
Overall Forecast Accuracy: Ensemble Leads
Across the 20 locations, the Ensemble recorded the lowest average city MAE at 2.02°F, followed by NWS at 2.19°F, ICON at 2.44°F, and GFS at 2.49°F. Each location counts equally in these averages. The Ensemble's MAE was about 19% lower than GFS's: (2.49 − 2.02) / 2.49 × 100 ≈ 19%. But that overall difference hides substantial local differences.
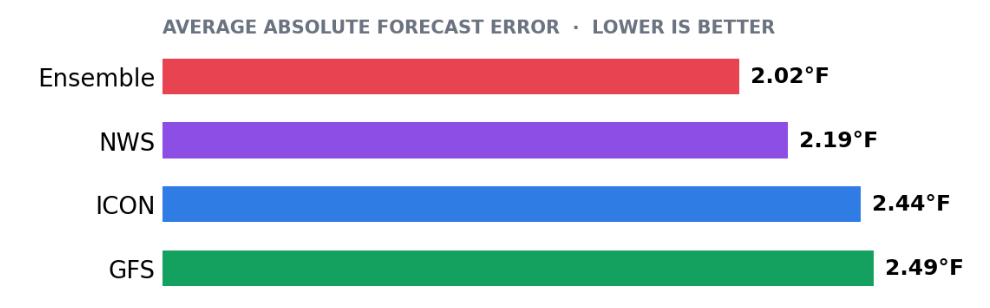
NWS was the single best forecast source in seven locations, the Ensemble in six, GFS in four, and ICON in three. The Ensemble ranked first on average, but NWS won the most individual locations. A trader using the same forecast source everywhere could miss that distinction.
Which Model Works Best in Each City?
The ranking changes noticeably across locations. The Ensemble leads in New Orleans, Atlanta, San Antonio, New York, Dallas, and Philadelphia. NWS leads in Denver, Seattle, Austin, Las Vegas, Oklahoma City, Phoenix, and San Francisco. GFS wins in Houston, Miami, Chicago, and the dashboard's Minneapolis entry, while ICON wins in Washington, Boston, and Los Angeles.
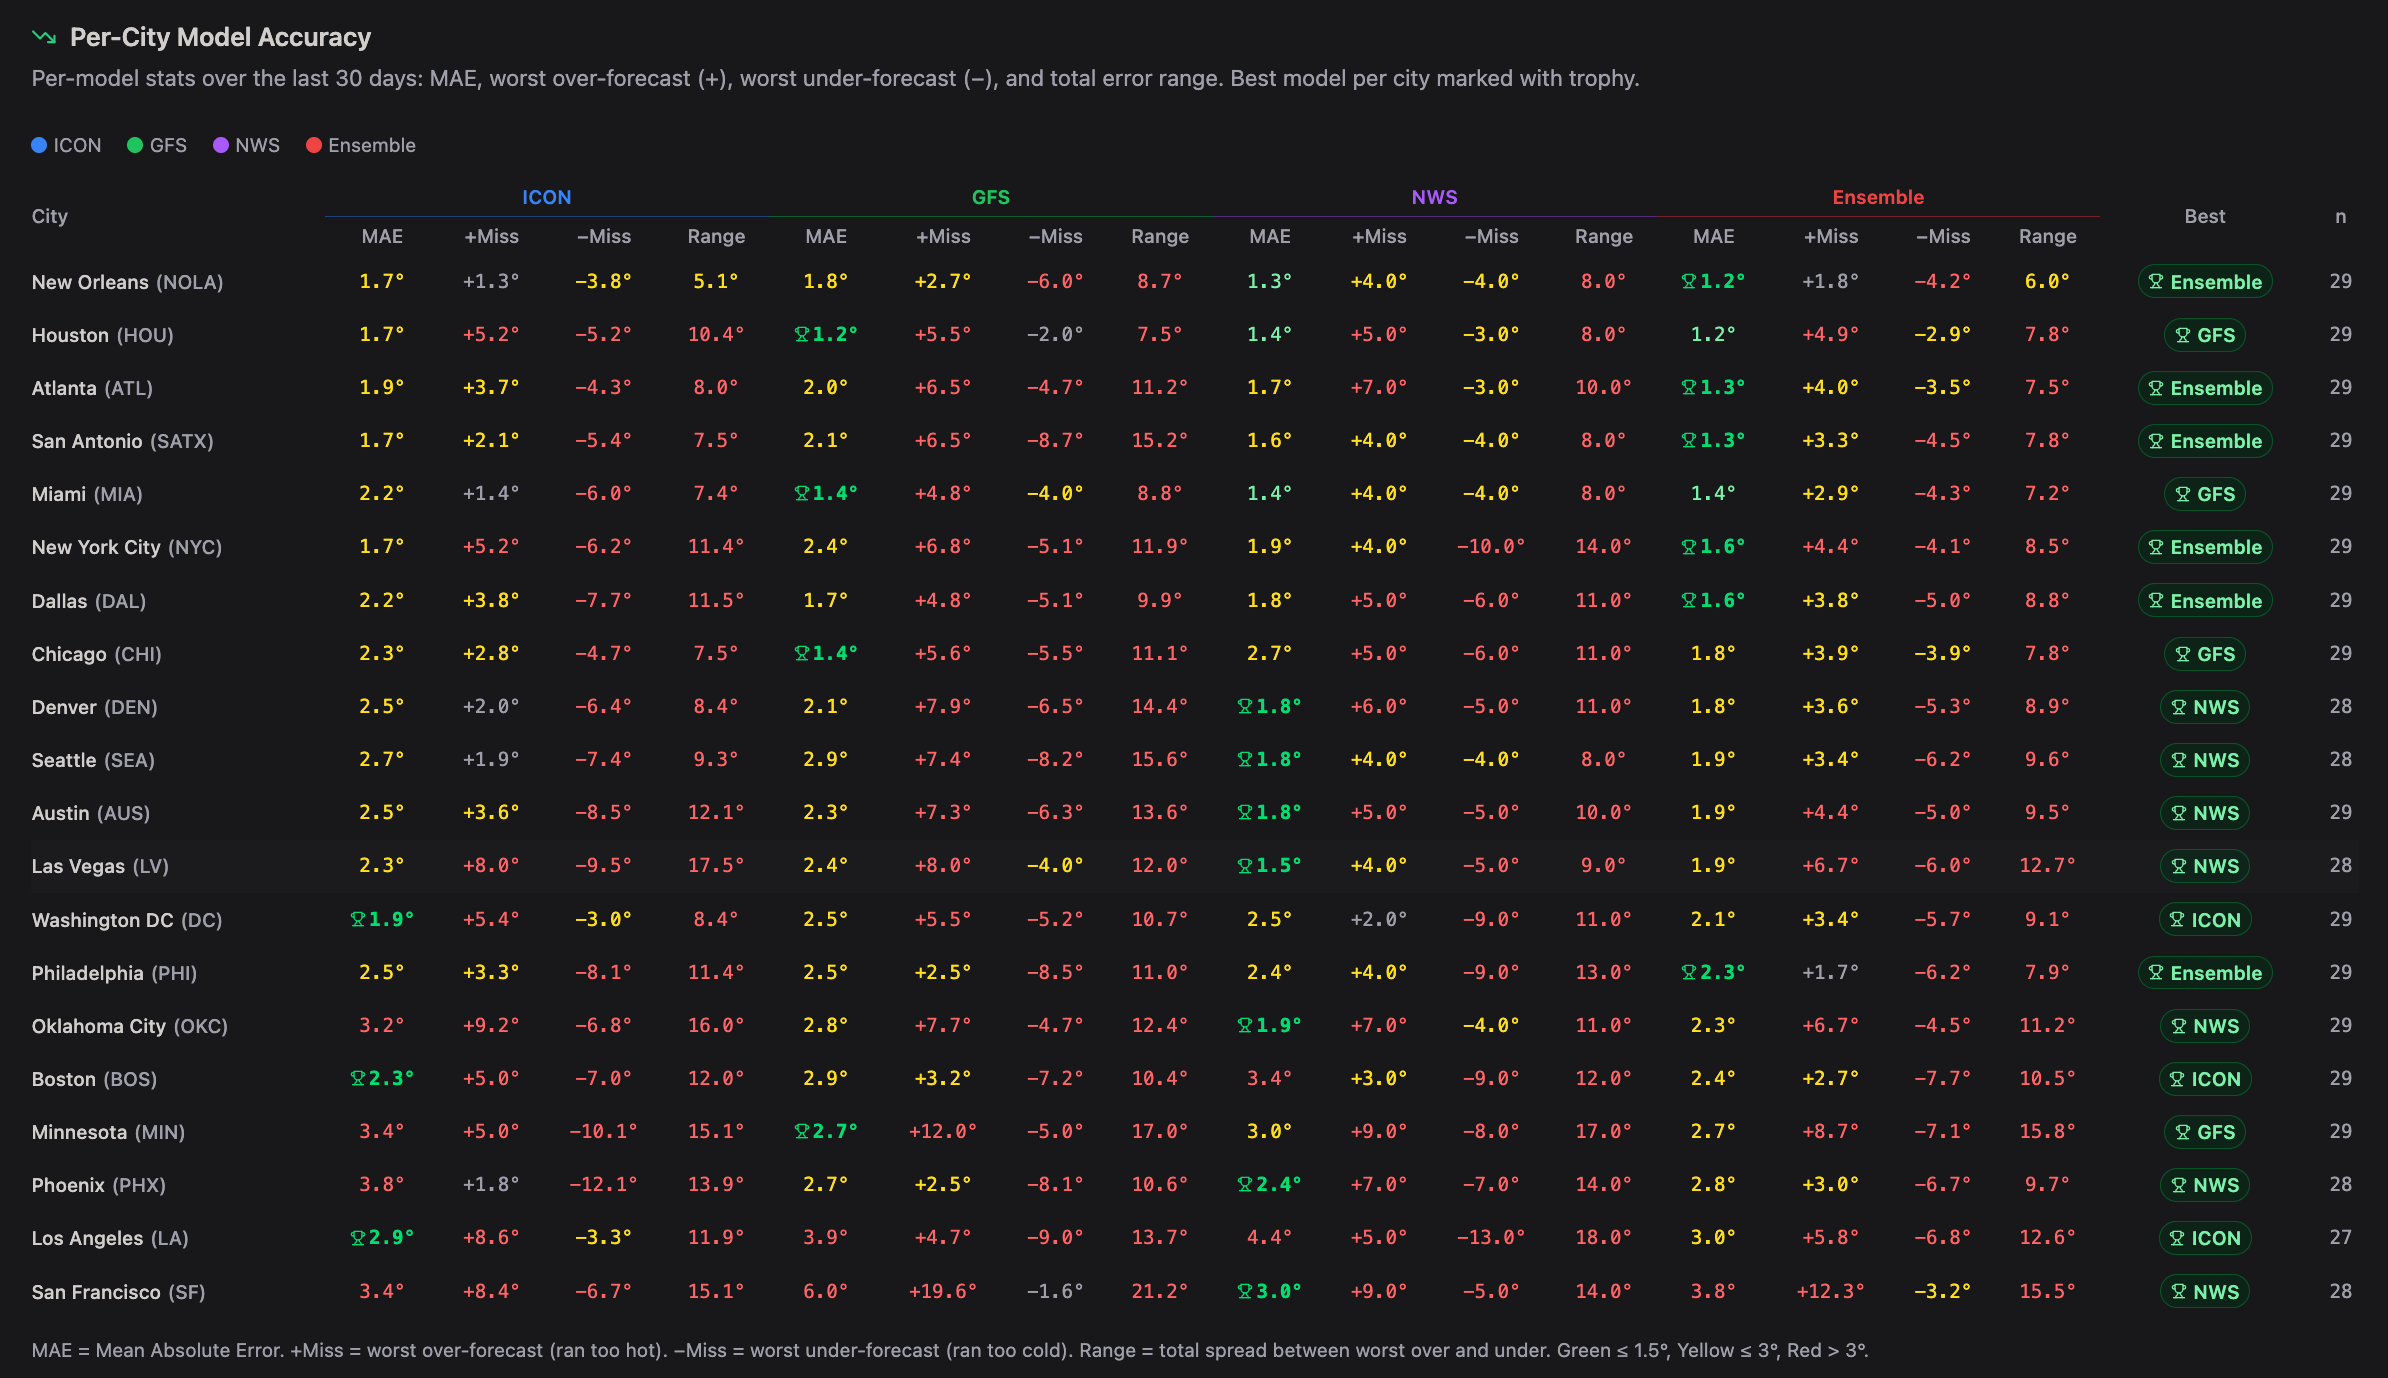
A model can be excellent in one location and noticeably less accurate in another. GFS averaged just 1.4°F of error in Chicago, yet 6.0°F in San Francisco. Likewise, NWS averaged 1.5°F in Las Vegas but 4.4°F in Los Angeles. Model reputation is less useful than the record for the specific location being traded.
Accuracy and Range Tell Different Stories
MAE captures the average absolute miss. The dashboard's displayed range measures the spread between the largest positive and largest negative forecast errors. It isn't a confidence interval or the number of degrees a forecast is expected to miss tomorrow. A model can have the lowest MAE and still produce a few unusually large errors.
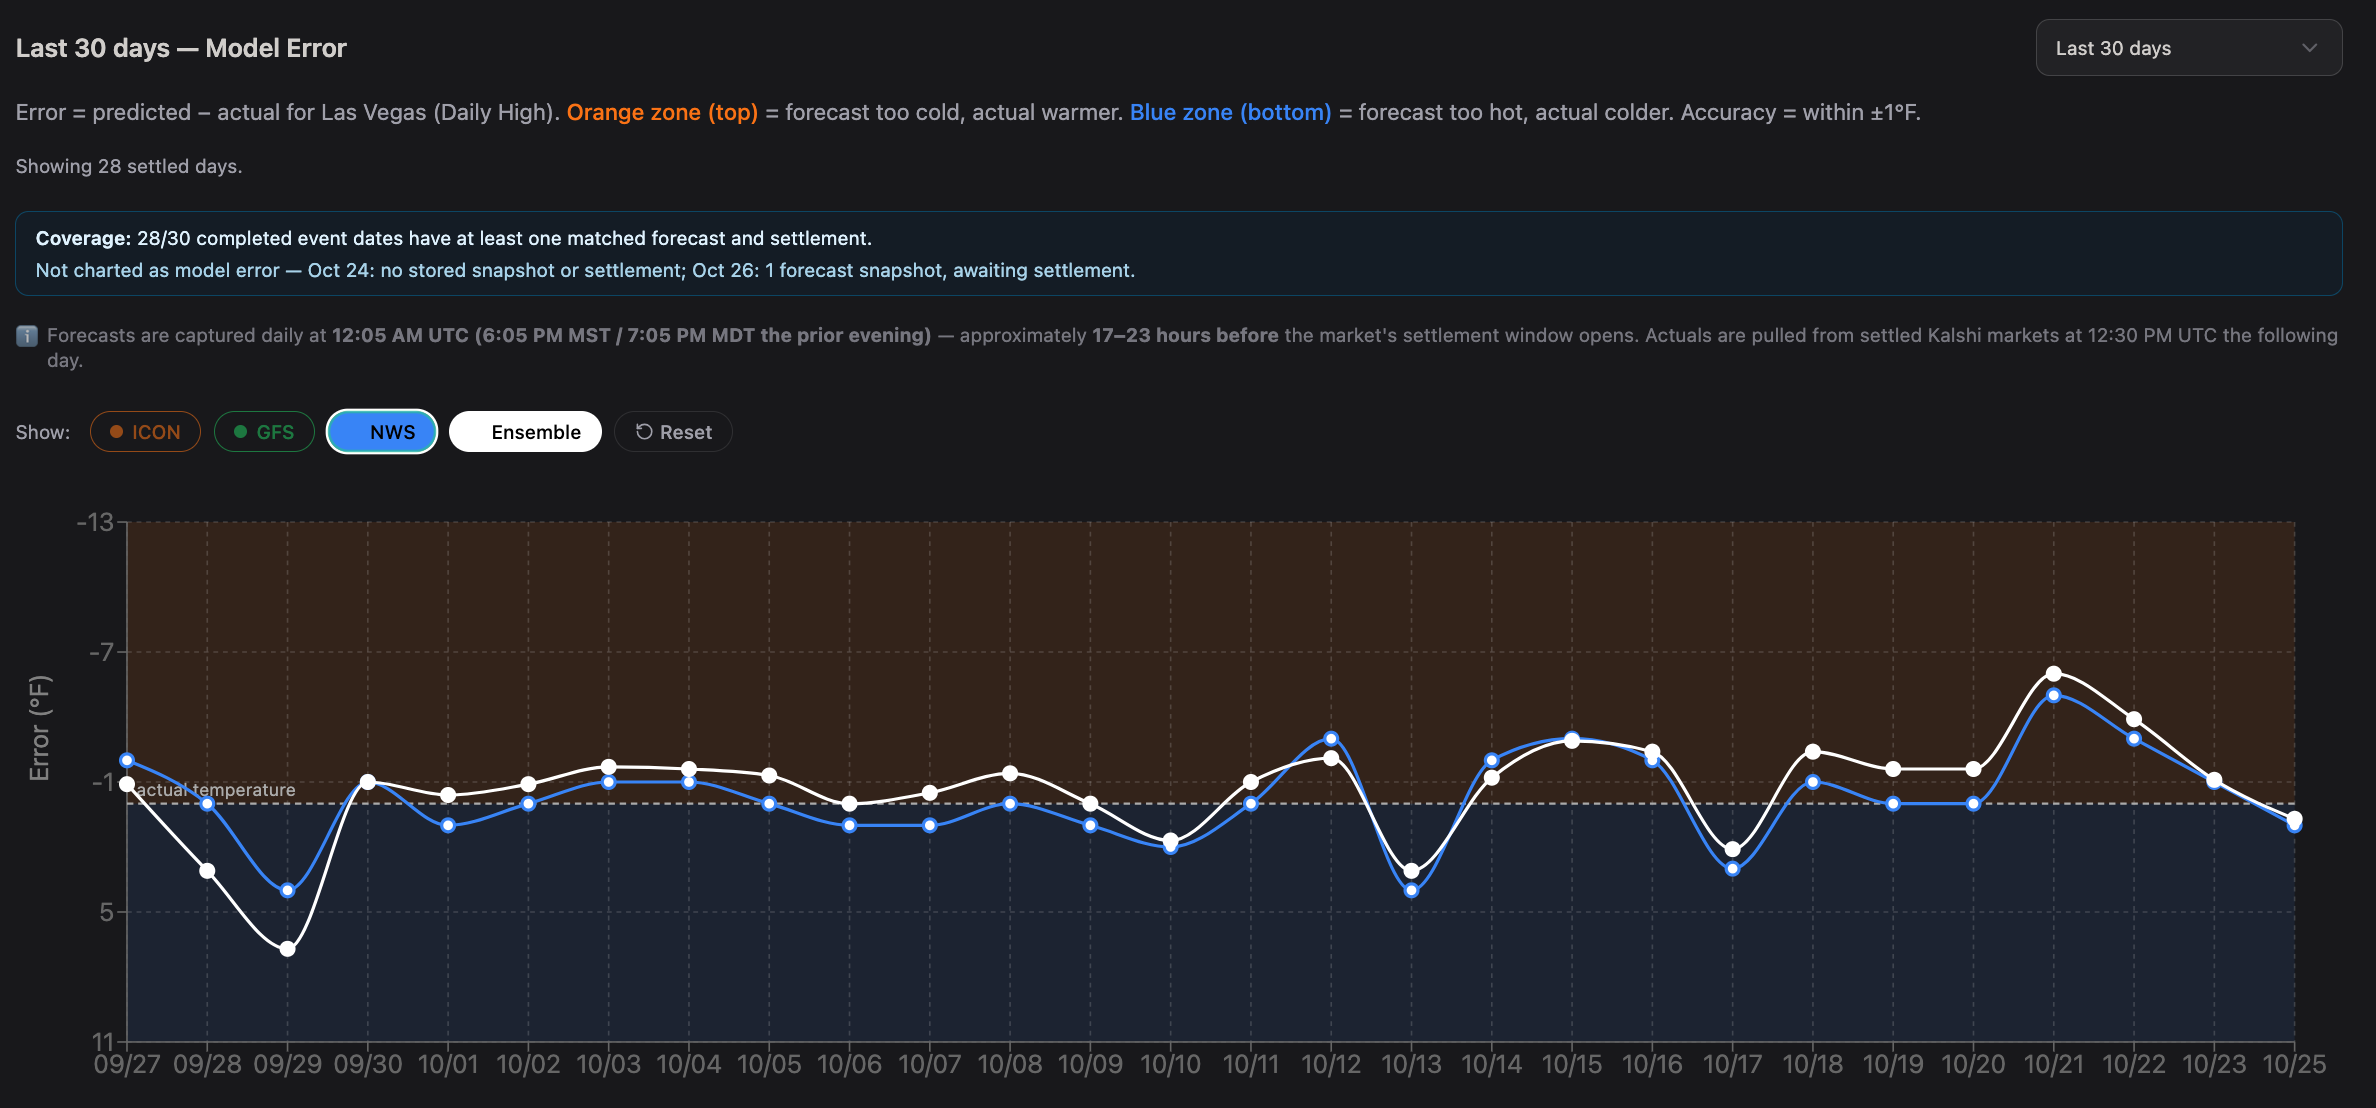
Chicago is a good example. GFS had the city's best MAE at 1.4°F, but its full miss range was 11.1°F. The Ensemble's MAE was higher at 1.8°F, yet its range was narrower at 7.8°F.
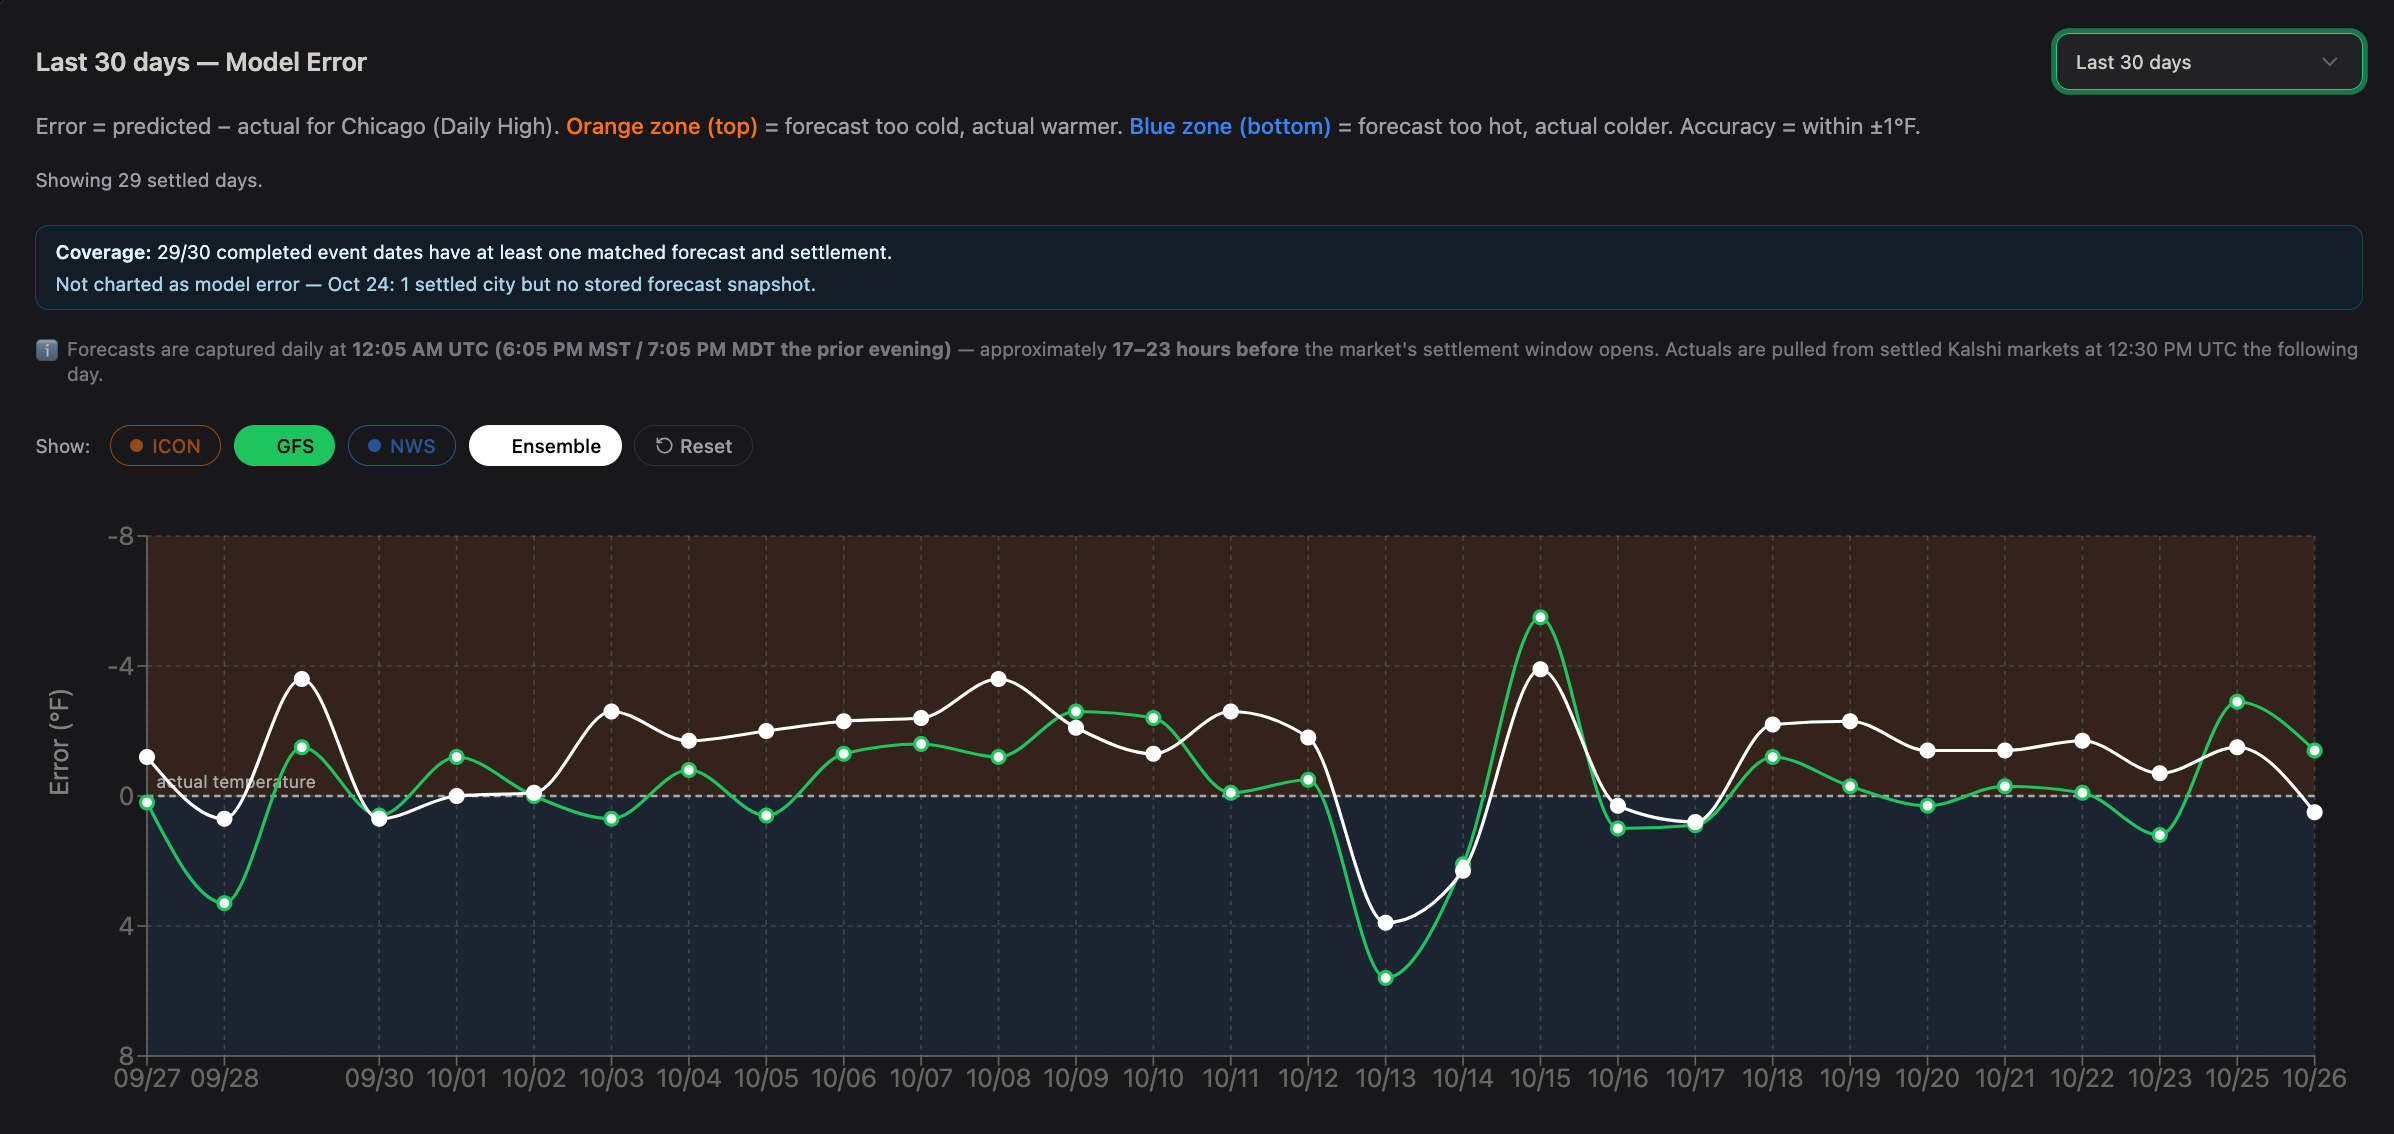
In Las Vegas, NWS combined a low 1.5°F MAE with a 9.0°F range, compared with 1.9°F and 12.7°F for the Ensemble. That's why average error and the size of larger misses deserve separate attention.
Market Example: Chicago Temperature Bins
Suppose a Chicago high-temperature market is trading several neighboring two-degree bins. GFS points toward one bin, while the Ensemble leans two degrees warmer. Looking only at the overall 20-location rankings would favor the Ensemble. But Chicago's recent results favor GFS on MAE, making its local forecast a useful starting point.
That doesn't make the GFS bin an automatic YES trade. The next question is how often Chicago GFS forecasts have finished above, below, and inside that bin at the same lead time. Those historical frequencies can inform a probability estimate, which can then be compared with the market price.
A forecast error statistic by itself isn't an estimate of the chance a particular contract wins.
How I'd Use This in Weather Trading
I'd begin with the best recent forecast source for each location, then compare it with the other two leading sources. When their forecasts are tightly grouped and historically well calibrated, there may be more confidence in the central outcomes. When forecasts disagree, or when the leading source has a wide historical miss distribution, I'd treat a precise single-bin prediction more cautiously.
The main improvement would be to track model performance separately by city, forecast lead time, and daily high versus daily low.
Where This Approach Can Fall Short
This sample is short, and model rankings may change with the season or weather pattern. The settling station and the specific market's listed resolution source must also match the observations used to evaluate model performance. For markets on Kalshi, the individual contract rules are the place to check that match.
Conclusion
The Ensemble was the most accurate forecast source on average across these 20 locations, but it wasn't the most accurate everywhere. NWS won the largest number of individual locations, GFS stood out in Chicago, and ICON was competitive in places such as Los Angeles and Boston.
The practical lesson is simple: choose models based on the city you are forecasting, not just on an overall leaderboard.
The better question is not simply what a model predicts, but how reliably it predicts this city and what its errors imply about each temperature bin.
Data source: Writer-supplied model dashboard, October 27, 2026. Forecast-performance figures are from that snapshot. MAE definition: NOAA / National Weather Service forecast-verification glossary.
This article discusses historical weather-model performance and forecasting concepts, not directional predictions, trade recommendations, or investment advice. Historical results don't guarantee future accuracy. This article includes a link to PredictQ partner Kalshi. We may earn a commission if you use it, at no extra cost to you. That helps keep the lights on here. Nothing in this piece is investment advice, and market prices and contract availability can change.