
A temperature market isn't just a collection of separate contracts. Put the ranges next to each other and their prices sketch a market-implied distribution. Sometimes that shape tells you more than the price of one contract.
If 85-86°F and 89-90°F are both priced as meaningful outcomes, why is 87-88°F cheaper than both? That doesn't automatically make the middle contract a good trade. It gives you a question worth investigating.
The useful shift is simple: don't just ask, “What temperature do I think it'll be?” Ask, “Does the whole market ladder make sense compared with the forecast?” If you're new to the platform, PredictQ's Kalshi guide covers the contract mechanics and fees before you start comparing ranges.
Ex. 1 - San Francisco: A Dip Between Equal-Width Ranges
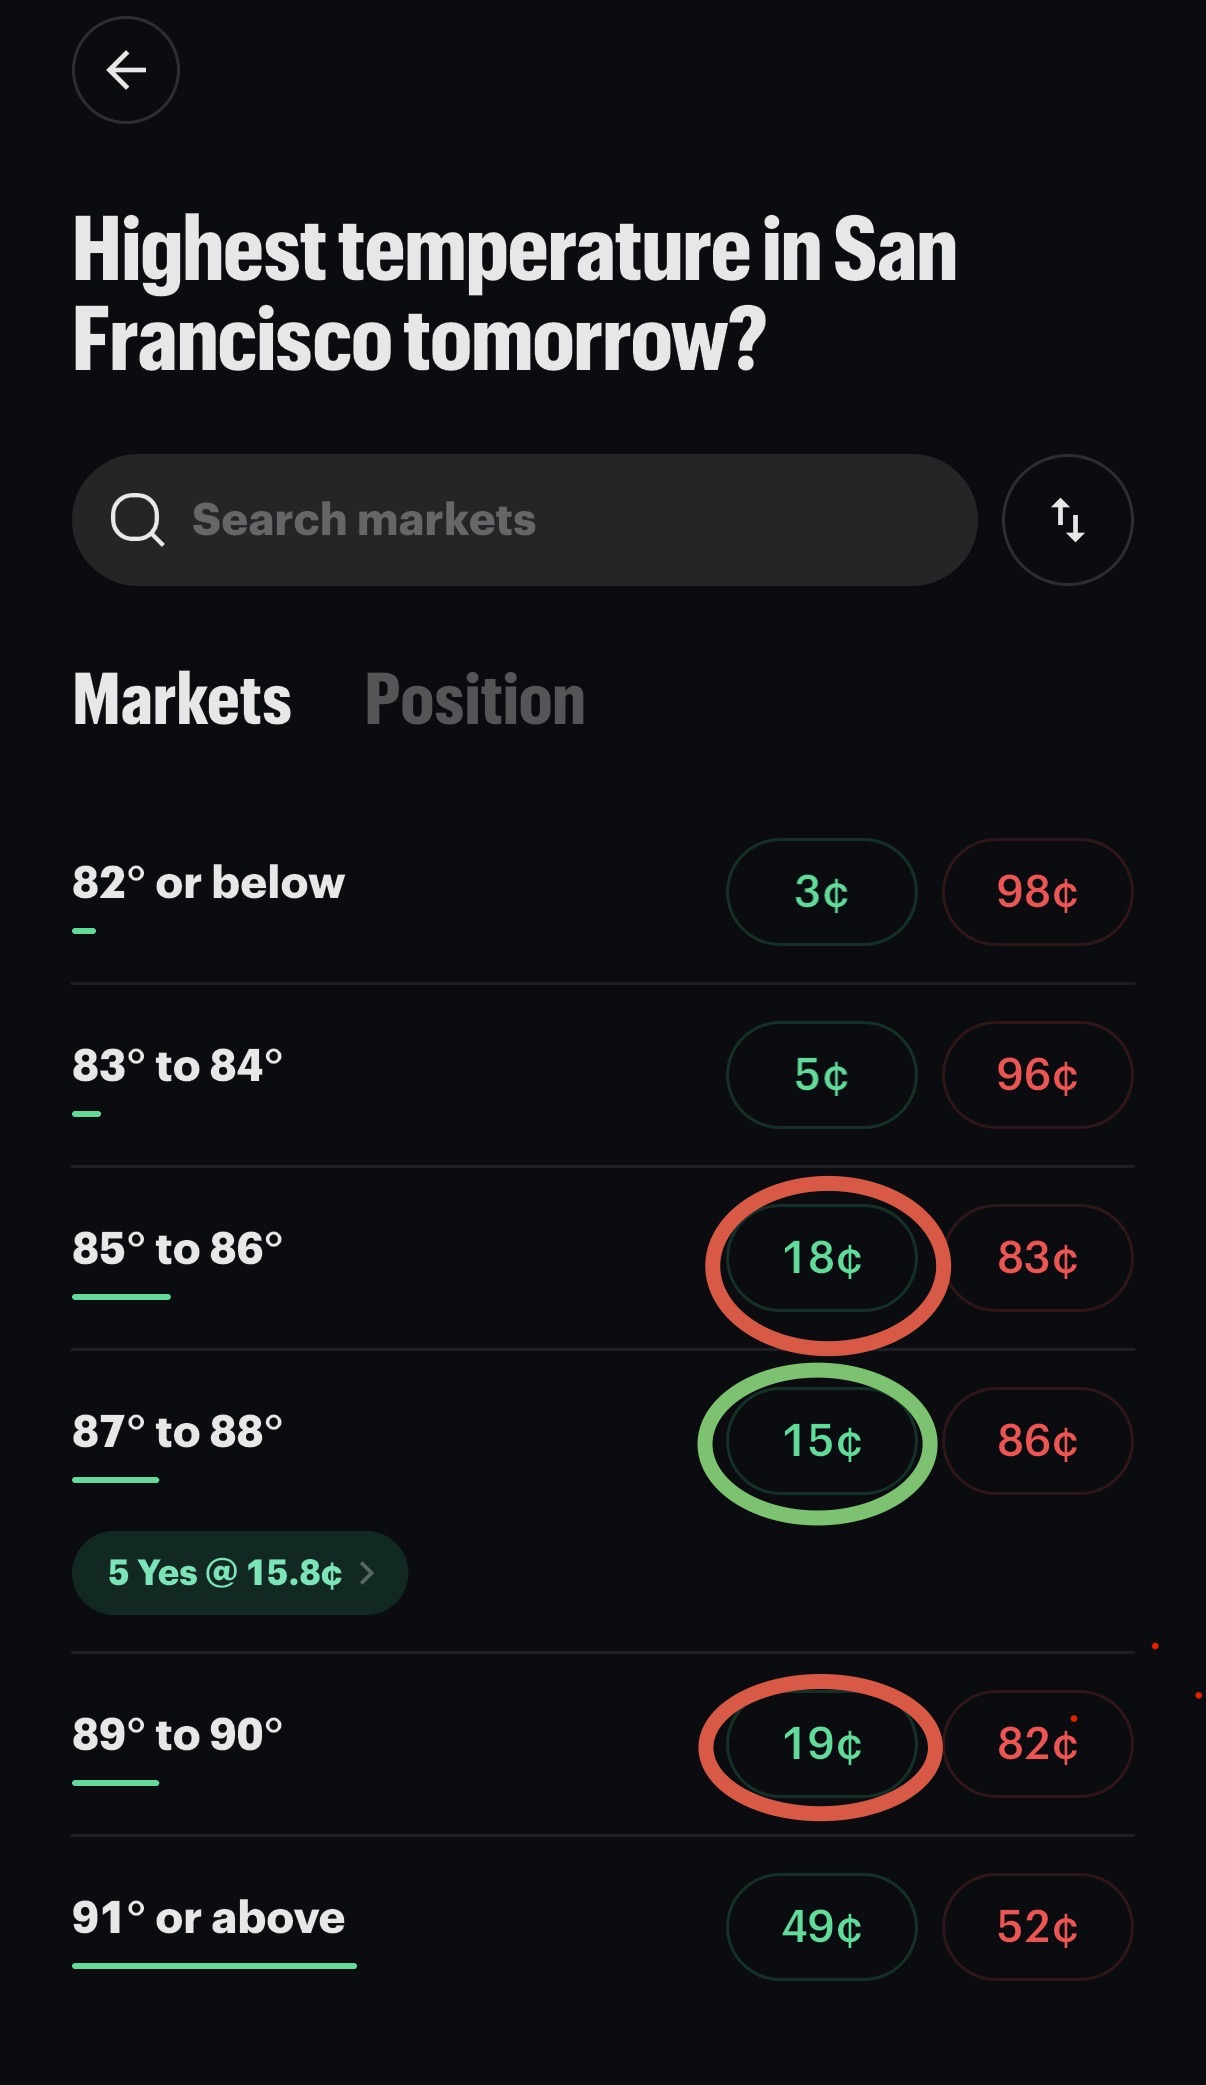
In the San Francisco snapshot supplied with this draft, 85-86°F was around 18¢, 87-88°F around 15¢, and 89-90°F around 19¢. The middle bin was 3¢ below its cooler neighbor and 4¢ below its warmer neighbor.
These are supplied example snapshots, not live quotes. The underlying market date, station, quote timestamp, and forecast runs aren't identified in the draft, so the figures shouldn't be read as a current trading opportunity.
San Francisco market snapshot (10/02/26) and accompanying forecast graphic:
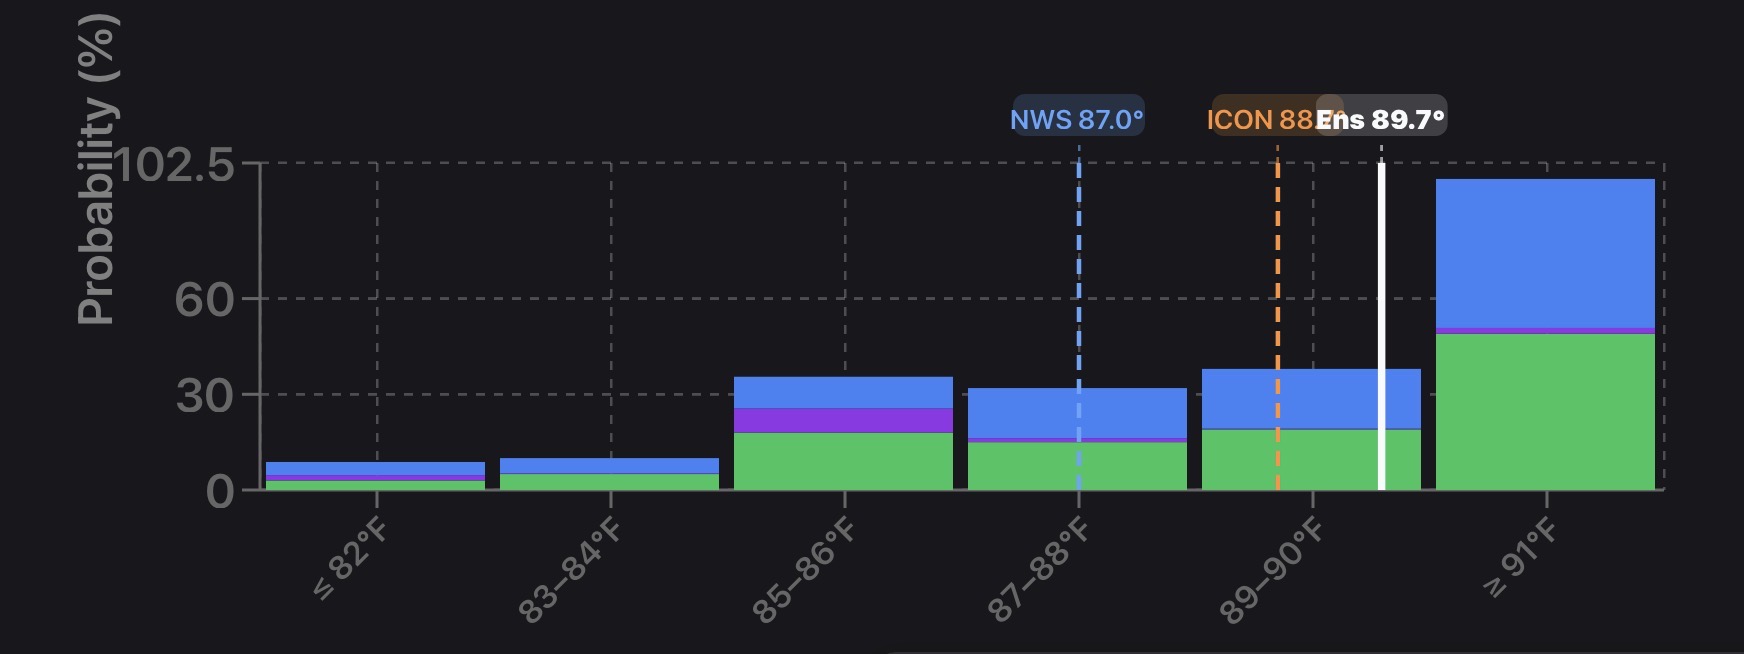
The supplied forecast figures were NWS near 87°F, ICON around 88.5°F, and an ensemble summary near 89.7°F. Those numbers put guidance in the neighborhood of these ranges, but they don't tell us the probability of landing in 87-88°F. An ensemble's central value isn't the same thing as its member distribution.
The point isn't that 15¢ must be wrong. It's that 18¢ → 15¢ → 19¢ is an uneven sequence worth checking. Before drawing a conclusion, make sure you're comparing the same kind of quote at the same time: executable bids, executable asks, or recent trades. A stale last trade beside a fresh ask can manufacture a “dip.”
Ex.2 - Los Angeles: Don't Treat a Tail Like a Two-Degree Bin
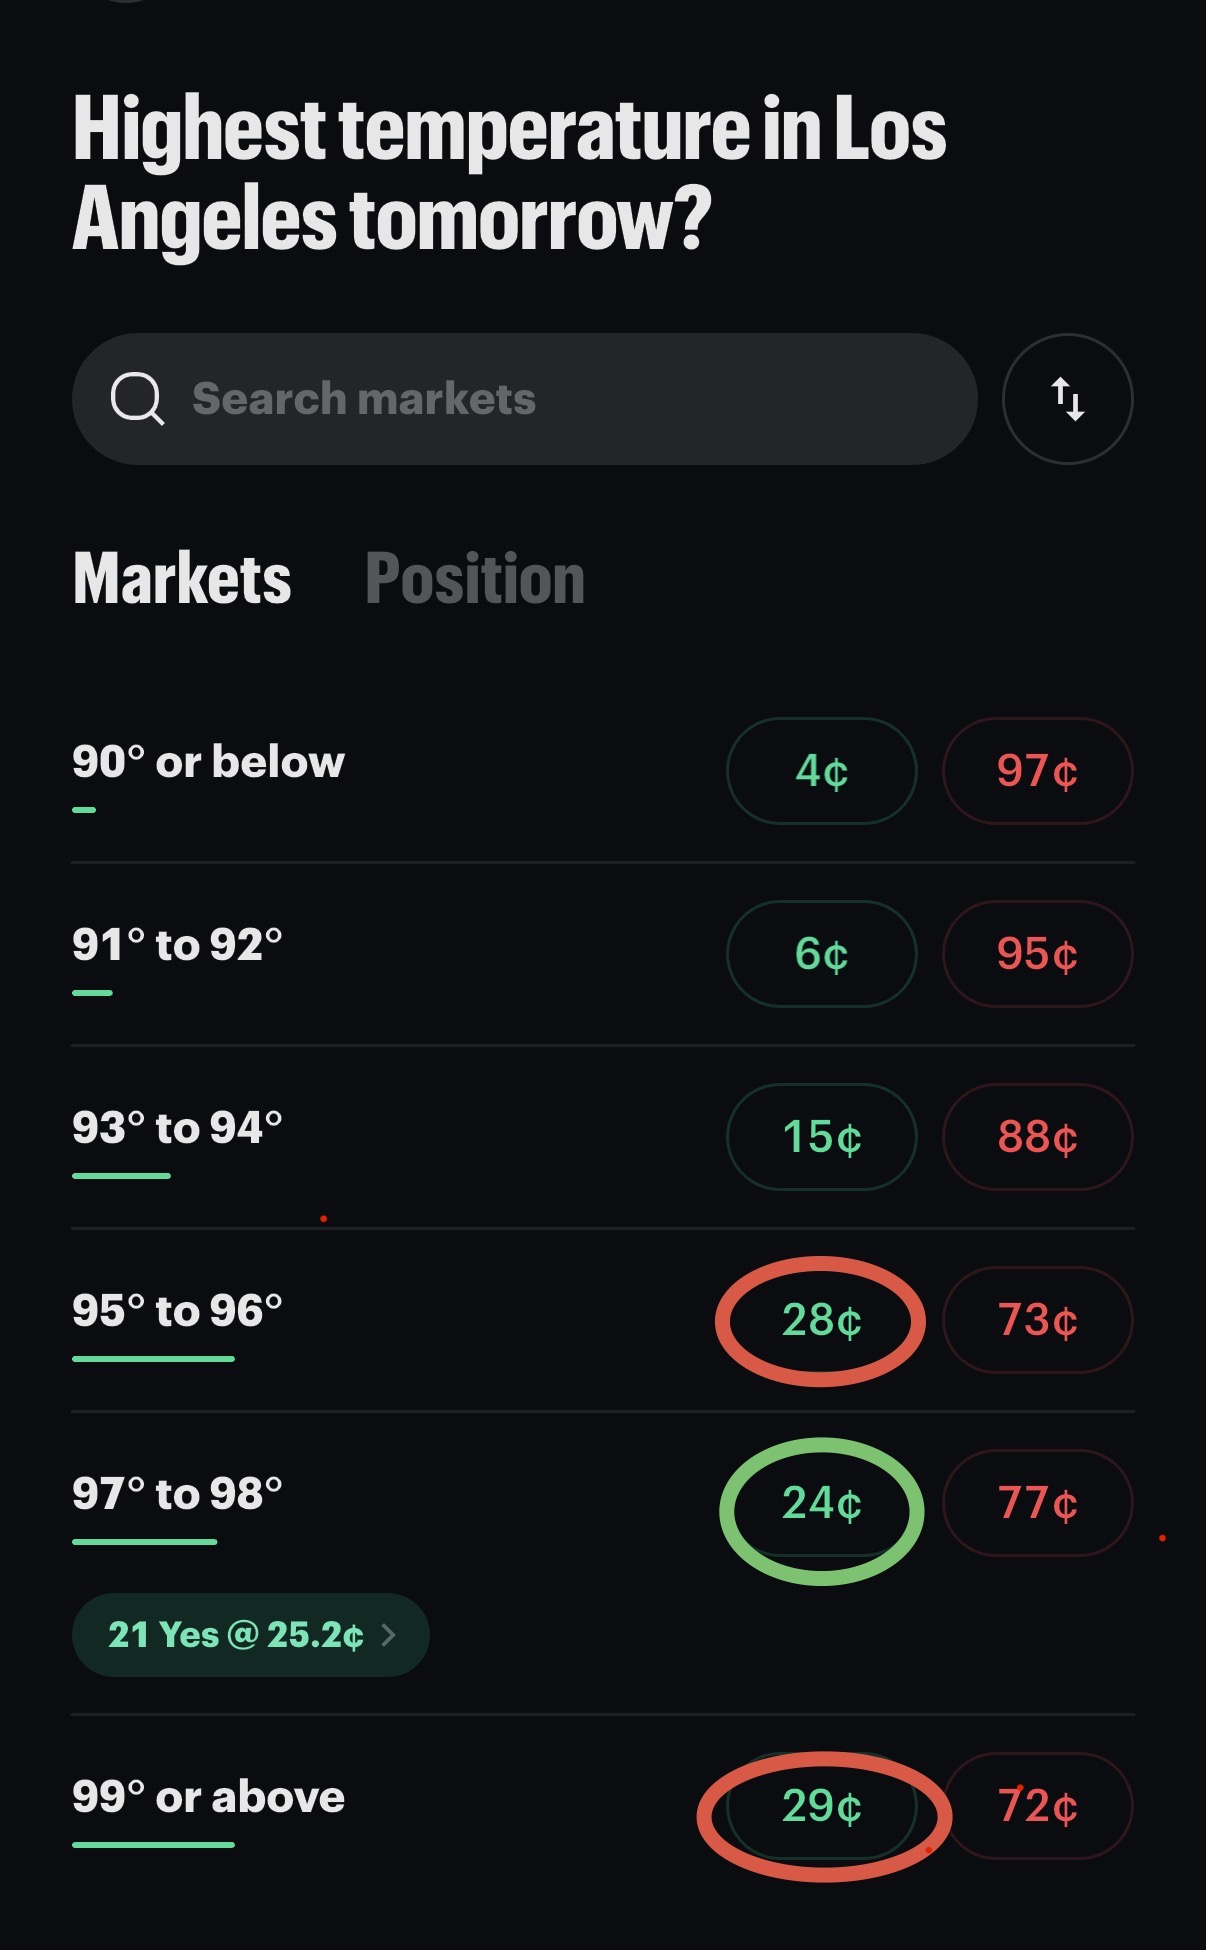
The Los Angeles snapshot shows 95-96°F around 28¢, 97-98°F around 24¢, and 99°F or above around 29¢. The middle range is cheaper, but these aren't three equivalent buckets.
The first two cover two degrees each. The last covers every qualifying outcome at 99°F or higher. That wider coverage can explain why the tail costs more than the middle bin without implying a pricing mistake.
Los Angeles market snapshot (10/02/26) and accompanying forecast graphic:
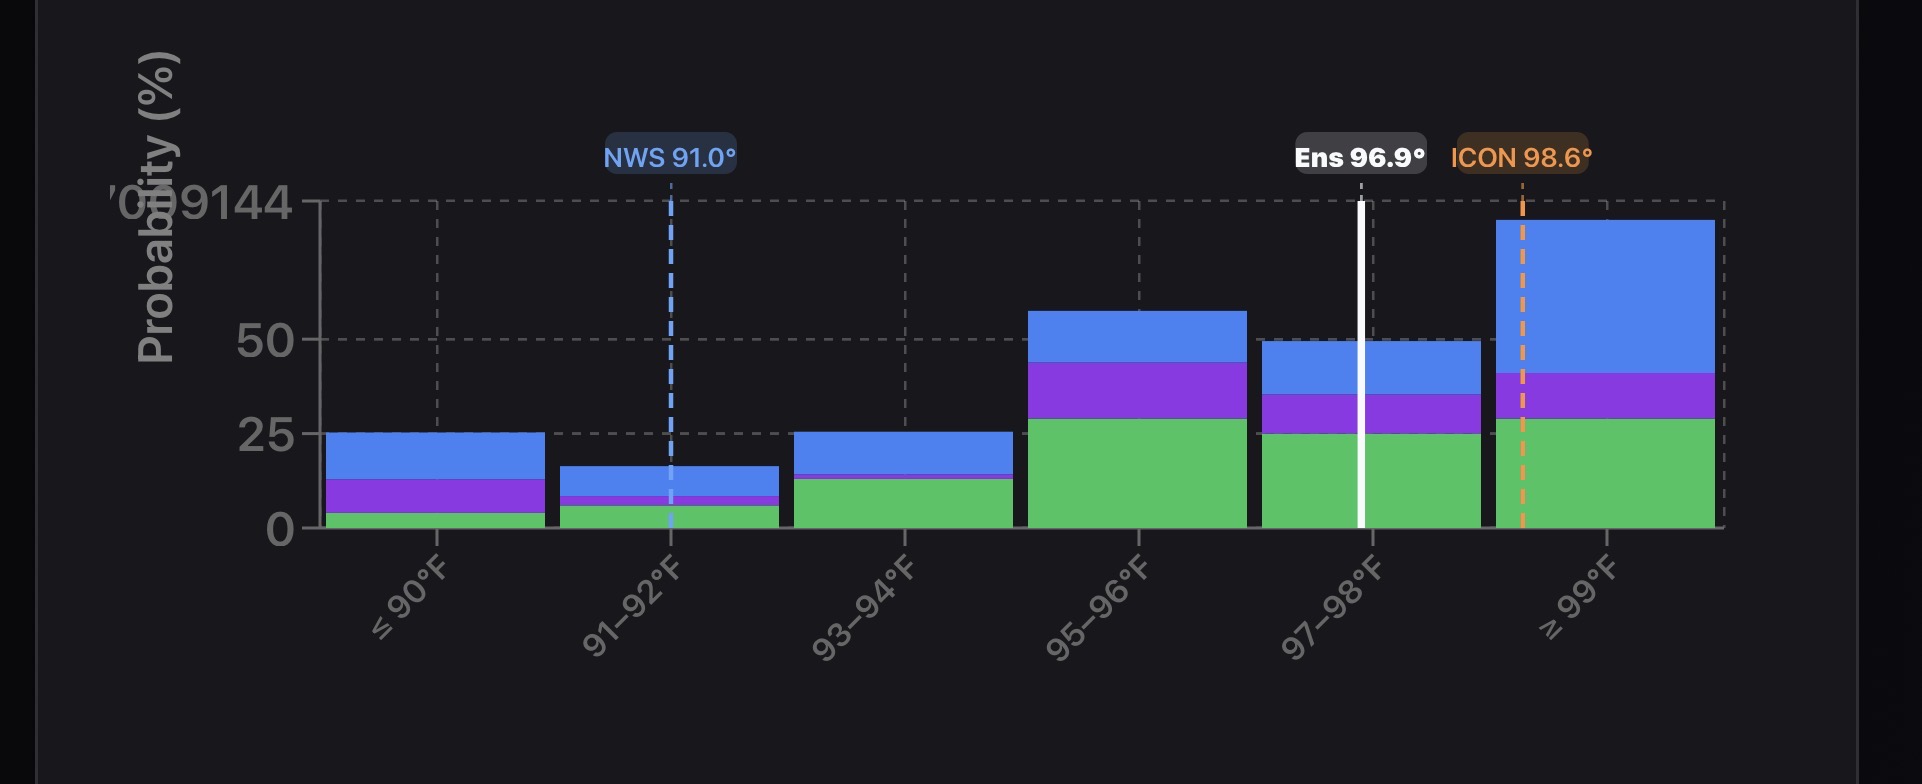
The supplied forecasts also disagreed: NWS was near 91°F, the ensemble summary around 96.9°F, and ICON around 98.6°F. That spread gives you a reason to investigate uncertainty. It doesn't establish a calibrated probability for any one range.
The clean comparison here is 28¢ for 95-96°F against 24¢ for 97-98°F. Then evaluate the 99°F+ tail separately, using the full forecast distribution rather than treating it as another two-degree bin.
Why Do These Dips Happen?
Prediction markets are built by buyers and sellers, not a machine that guarantees a smooth curve. One range can have more resting orders than another. A trader can move a contract after a model update. Thin liquidity and wide spreads can leave temporary gaps between neighboring ranges.
Weather can create real asymmetry, too. Cloud cover, marine layers, fronts, rain, and wind shifts can make one side of a temperature distribution more plausible than the other. In San Francisco, a stubborn marine layer can limit heating, while earlier clearing can allow a warmer outcome.
An uneven market isn't automatically a mispriced market. First ask whether the weather supports the shape. Then ask whether the quote data and available liquidity support the apparent opportunity.
The Forecast Distribution Matters More Than One Number
An 88°F point forecast doesn't tell you how much uncertainty sits around it. A tight setup with most guidance between 87°F and 89°F is different from one with plausible outcomes from the low 80s into the 90s.
Ensemble members can help show the spread and clustering of possible outcomes. But a mean alone won't show that spread, and member counts aren't automatically well-calibrated probabilities. Check model bias, forecast lead time, and how closely the guidance matches the settlement station.
Likewise, contract prices are only an approximate probability signal. Spreads, fees, thin liquidity, and different quote timestamps can prevent the ladder from behaving like a tidy distribution. Don't stack multiple probability estimates and call their sum a single probability.
Check the Rules Before the Curve
A two-degree range such as 87-88°F isn't the same thing as an open-ended contract such as 91°F or above. Tail contracts cover more possible temperatures, so they can reasonably carry more probability than a narrow middle bin. Even equal-width bins don't have to form a perfect bell curve.
Match your forecast to the contract's station, measurement period, and settlement source. For daily high/low markets, Kalshi's weather-market rules guide explains that the final NWS climate report determines settlement. A general city forecast or a reading from your weather app isn't the settlement result.
A Simple Way to Read the Market
Start with the full ladder. Check the market date, station, contract boundaries, and quote timestamps. Find where the prices are concentrated, then compare equal-width ranges on either side. Evaluate open-ended tails separately.
Next, compare the shape with NWS guidance, ensemble members, ICON, GFS, historical bias, and the actual weather setup. If forecasts cluster near a cheaper range, investigate why. Don't assume a nearby point forecast proves that range is underpriced.
Finally, check the executable price, spread, fees, and depth. A 15¢ quote is 3¢ cheaper than an 18¢ quote, but that difference alone says nothing about the expected return. You still need a defensible probability estimate and a realistic execution cost.
The Question That Matters
The goal isn't to force every market into a perfect bell curve. Real weather can be skewed, and open-ended tails behave differently from narrow ranges. Looking across the ladder helps you ask better questions, not skip the research.
When you see a cheaper middle bin, what would you check first: the weather setup, the quote quality, or the contract's settlement rules?
PredictQ is a marketing partner of Kalshi, and this article links to our Kalshi guide. We may earn a commission if you sign up through the partner links there. It doesn't cost you anything extra, and it helps keep the lights on here. This piece is educational, not a trade recommendation or investment advice. Forecasts can be wrong, and prices, odds, and market conditions can change.