
Peter Nickerson
9/20/26
Climate & Weather Analyst
High vs. Low Temperature Markets: Why They Behave Differently
High-temperature and low-temperature prediction markets may look almost identical, but forecasting them is not the same. A daily high market asks how warm a location will get, while a daily low market asks how cold it will get. The difference sounds simple, but the weather processes behind each one are very different.
The easiest way to think about it is that high temperatures are mainly about heating, while low temperatures are mainly about cooling. That changes which weather variables matter, when new information becomes useful, and even how accurate the same model can be from one market type to the other.
Daily highs are usually reached during the afternoon after the sun has spent several hours heating the surface. Sunshine, cloud cover, precipitation, wind, atmospheric mixing, and frontal timing can all affect how high the temperature eventually climbs. If a city is already close to its forecast high by noon under clear skies, hotter outcomes can become more likely. If thick clouds or rain arrive early, additional heating can quickly slow down.
Low temperatures work differently because most of the cooling occurs after sunset. Once solar heating disappears, the surface begins losing heat. Clear skies can allow stronger cooling, while clouds can slow that process. Wind, humidity, dew point, terrain, and frontal timing can also determine whether temperatures continue falling or level off overnight.
This means a model that performs well on afternoon highs does not automatically perform just as well on overnight lows. Looking at roughly the past 160 settled days in Las Vegas shows how large that difference can be, although the exact sample size varies by model availability. Kalshi runs daily high and low temperature contracts for cities like these, so knowing which model to trust for which market type is worth more than it might seem.
Las Vegas Forecast Accuracy - Daily High vs. Daily Low
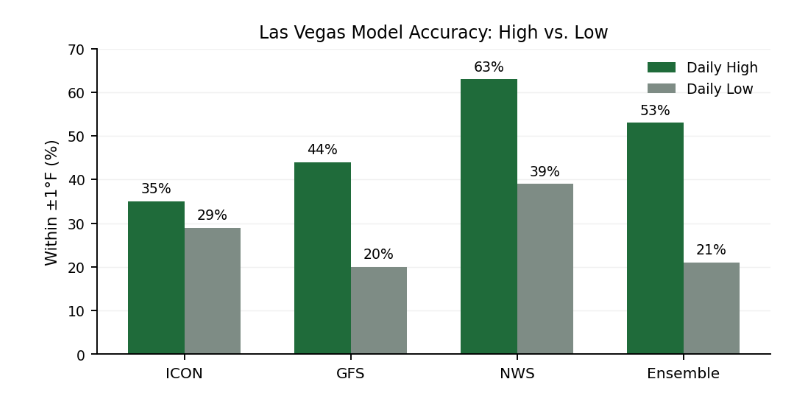
For Las Vegas highs, the NWS forecast finished within ±1°F of the actual high 63% of the time, while the Ensemble did so 53% of the time. GFS came in at 44% and ICON at 35%. The low-temperature results were much weaker: NWS was within one degree 39% of the time, ICON 29%, Ensemble 21%, and GFS only 20%.
The direction of the misses also changed. The GFS Las Vegas low forecast had an average bias of -3.7°F, meaning it was much too cold on average. The actual low finished warmer than the GFS forecast on 74% of the available days. The Ensemble had a -2.1°F low bias and finished too cold 72% of the time. By comparison, both models were much closer to neutral when forecasting Las Vegas highs.
It would be easy to look at Las Vegas and conclude that low-temperature markets are simply harder. New Orleans shows why that would be the wrong lesson. In this sample, every model was actually more accurate on New Orleans lows than on New Orleans highs.
New Orleans Forecast Accuracy - Daily High vs. Daily Low
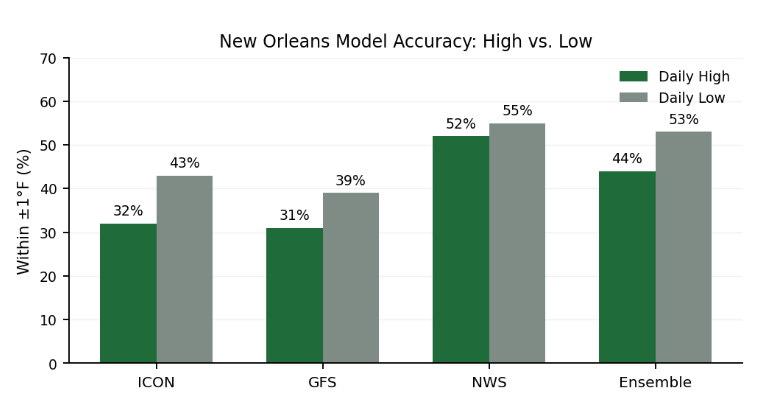
For New Orleans, the NWS improved from 52% accuracy on highs to 55% on lows. The Ensemble improved from 44% to 53%, ICON from 32% to 43%, and GFS from 31% to 39%. The average biases were also smaller overall than the large cold bias seen in Las Vegas lows. That tells us model behavior depends on the city and local climate, not just whether the market is a high or a low.
Market Example:
Suppose the GFS forecasts a Las Vegas low of 60°F. Looking only at that forecast might make 60°F seem like the center of the expected outcome. But the historical sample adds important context: GFS lows in Las Vegas averaged 3.7°F too cold, and the actual temperature finished warmer than the forecast 74% of the time.
That does not mean the next low will automatically finish warmer. Historical bias is not a guarantee. It means the forecast should be interpreted with information about how that specific model has behaved for that specific city and market type. A 60°F GFS low in Las Vegas carries different historical context than a 60°F GFS low in New Orleans.
Conclusion:
High and low temperature markets should not be treated as the same forecasting problem. Highs are driven mainly by daytime heating, while lows depend more heavily on overnight cooling. Because those processes are different, model accuracy and bias can also change dramatically between the two.
The Las Vegas data shows several models performing much better on highs, while the New Orleans data shows the opposite pattern. The main lesson is not that highs or lows are always easier. It is that each city, model, and market type needs its own historical context.
Instead of only asking, "What temperature does the model forecast?" a more useful question is, "How accurate has this model been forecasting this type of temperature in this city, and which direction does it usually miss?" That extra context can turn a basic forecast into a much more useful probability estimate. Next time you're sizing up a temperature contract on Kalshi, that's the question worth asking before the model's raw number.
What's your read: is there a city or model pairing you'd want us to run these numbers on next?
This article discusses historical weather-model performance and forecasting concepts, not directional predictions, trade recommendations, or investment advice. Historical results do not guarantee future accuracy. This article includes links to PredictQ partners like Kalshi. We may earn a commission if you use them, and it doesn't cost you anything extra. It helps keep the lights on here. Prices, odds, and entry counts can change.